XP Inc. (XP)
XP Inc. has fallen sharply to 15.71, down 8% over the past week and sitting just 14% above its key support level of 13.46. The decline follows the Brazilian presidential election, which has weighed on investor sentiment in the region. Both the weekly and daily charts are moving in the same direction — downward — which means the near-term and longer-term pictures agree.
The long-term picture
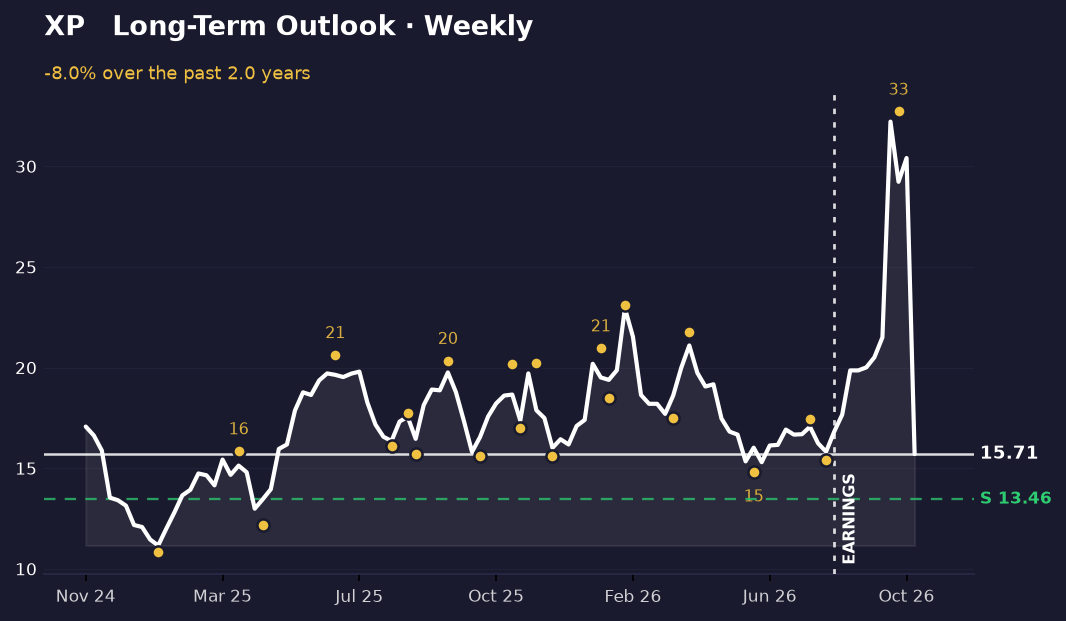
Over the past several months, XP has traced a dramatic arc. The stock climbed from a low of 14.80 in mid-June to a peak of 32.73 in mid-October — more than doubling in value. That October high marked the turning point. Since then, price has collapsed, falling back below 16 and erasing most of those gains. The stock now sits 51% below its recent peak and only 41% above the lowest point it reached during this entire period.
The weekly chart shows XP is positioned near the bottom of its recent range. Support sits at 13.46, and the stock is currently 14% above that level. There's no resistance overhead — the path higher is clear, but momentum is pointing downward. The August earnings report, marked on the chart, came before the October rally, so it didn't trigger the move up. The recent decline appears tied to the Brazilian election results and broader weakness in emerging markets.
The short-term picture
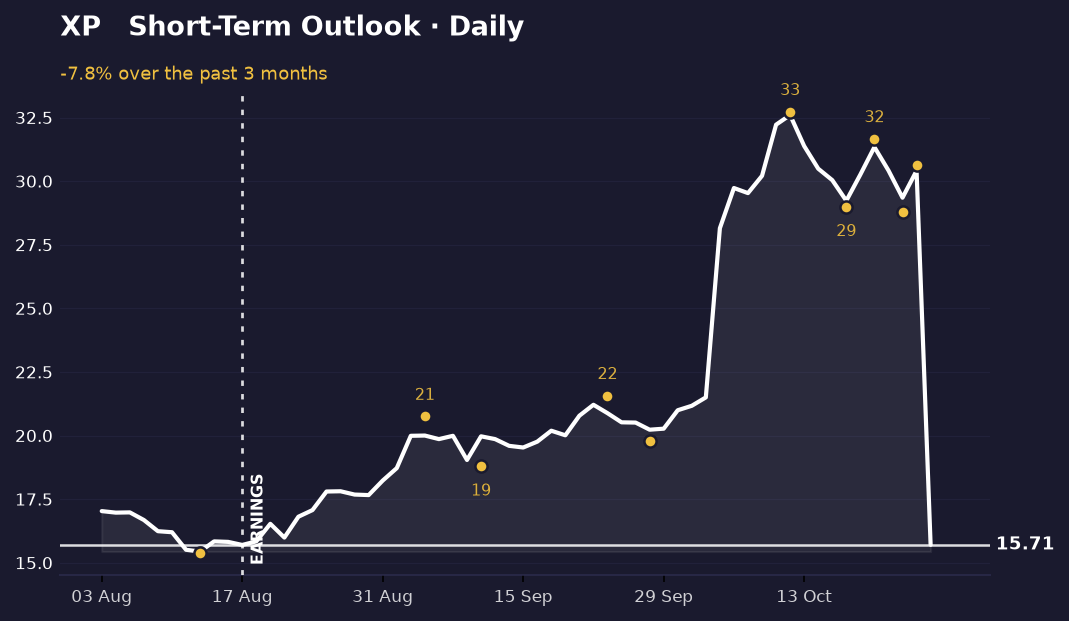
The daily picture reinforces the weekly view. Price has been oscillating in a tight band between roughly 28.77 and 31.66 over the past few days, but these recent swings are happening at much lower levels than the October peak of 32.6. The stock is now trading at the very bottom of its recent daily range — just 1.7% above the lowest close of the past several days. This positioning suggests momentum is exhausted and sellers remain in control.
Both timeframes agree: the trend is down, and there's no sign of reversal yet. The daily chart shows no clear support or resistance levels marked, which means price could move lower without hitting a defined technical barrier until it reaches the weekly support at 13.46. That's roughly 14% below current levels.
What's driving it
The most recent catalyst is the Brazilian presidential election, which triggered a sharp selloff in XP and broader emerging-market exposure. A Brazil-focused ETF sank 21% following the election results, and XP shares declined in tandem. The company reported earnings on August 17, which is marked on both charts, but that event preceded the October rally and doesn't explain the recent decline.
No upcoming earnings date is supplied in the available data. The current price action appears driven by macroeconomic and political factors affecting Brazil and emerging markets generally, rather than company-specific news.
What would change this
The bearish read would break if price holds above 13.46 and then reverses upward with conviction. A close above 17.45 — the swing high from late July — would signal that the downtrend is losing steam and that buyers are stepping in. That level is roughly 11% above the current price.
Conversely, a break below 13.46 would confirm that the decline is accelerating and would open the door to further losses. The weekly chart shows that 13.46 is the key floor; losing it would mean price has fallen below the lowest point of the entire recent period and would likely trigger additional selling.
Key takeaways
- XP has fallen 51% from its October peak of 32.73 to the current 15.71, erasing a two-month rally.
- The stock is now 14% above its key weekly support level of 13.46, leaving limited margin for error.
- Both weekly and daily charts are aligned downward, with no reversal signals yet in place.
- The recent decline follows the Brazilian presidential election and weakness in emerging-market sentiment, not company-specific news.
This one was our pick. The next one is yours.
You've just read the public write-up for XP. A free account adds the full Pulse Report — the one that normally costs credits — on a symbol you choose, saved to your account and emailed to you.
- One full Pulse Report a week, on any symbol from the published list
- A five-symbol watchlist with live prices and signals
- Earnings dates, analyst targets, news and basic financials for what you follow
- Multi-timeframe charts with the indicators you choose
- Email alerts when something you're watching moves
- Deeper reports in three tiers when you want them — Pulse, Insight and Alpha
No card needed.
Research and education only — not financial advice, and not a recommendation to buy, sell or hold any security. Analysis is generated with AI assistance from measured price data and may contain errors. Prices shown were accurate at the last update. Full terms · How we produce this