10x Genomics, Inc. (TXG)
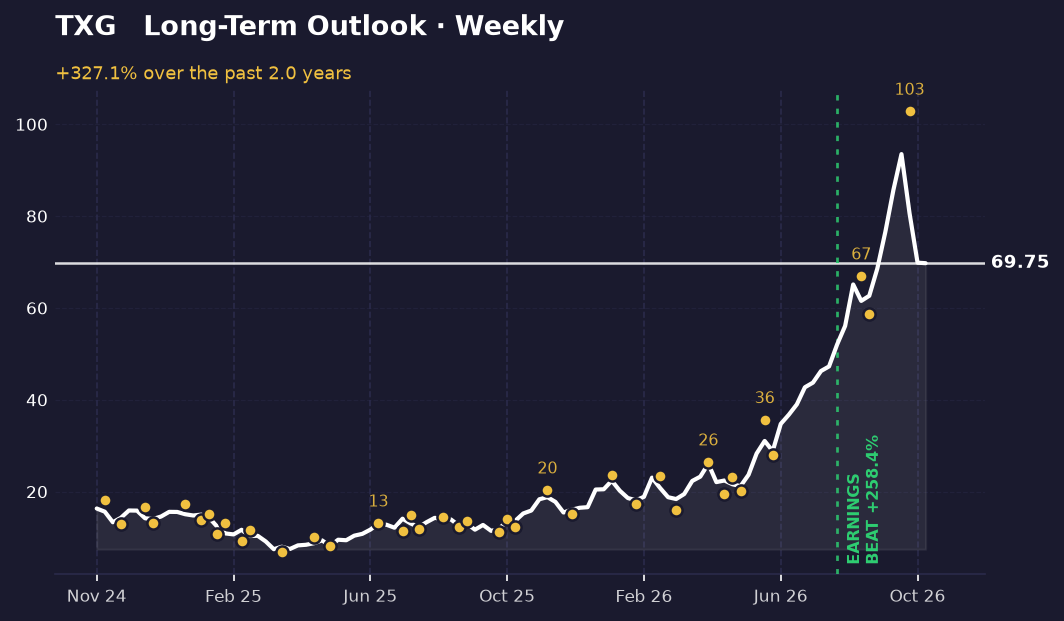
10x Genomics has climbed about 327% on the weekly chart since the start of the period we're looking at, closing near $69.75 after bottoming around $7.47 and peaking near $93.50. Both the longer and shorter charts are moving in the same direction, which is worth a look.
The long-term picture
On the weekly chart, the stock is in a clear uptrend. The highs and lows tell the story: a swing low near $28.01 in mid-June, a high near $66.94 in late August, a pullback to about $58.70 in early September, and then a climb to a swing high near $102.81 in early October. Each higher low and higher high is the signature of an uptrend.
Today's price sits about 25% below the highest closing price in the period and about 834% above the lowest close. Put another way, it's roughly three-quarters of the way up its recent closing range, so it has come back a fair distance from the peak but remains well above where it started.
The short-term picture
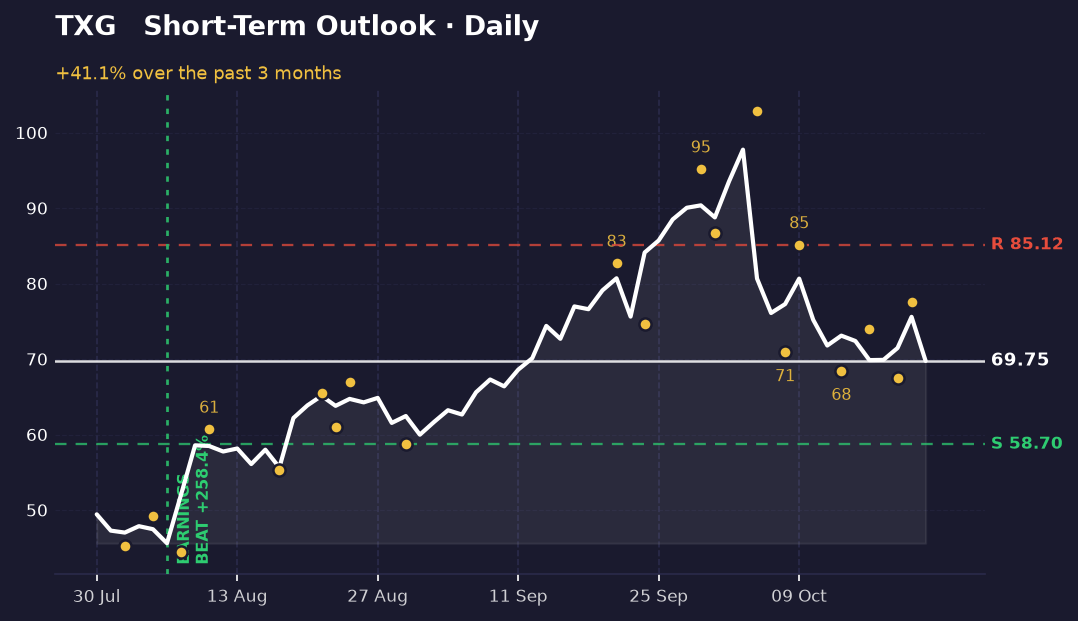
The daily chart shows momentum still leaning up. Recent swings run from a low near $68.45 in mid-October to a high near $77.55 on October 21, with a higher low near $67.53 on October 20. That pattern of rising lows is what buyers look for when they're in control.
The two timeframes agree here. Weekly and daily are both moving upward, so the short-term picture isn't fighting the longer trend.
The nearest levels to watch are support near $58.70, about 16% below the current price, and resistance near $85.12, about 22% above it. Price is sitting in the lower part of that band, which leaves room in both directions.
What's driving it
The most recent earnings report was on August 6, 2026, and it beat expectations by a wide margin, with results about 258% above the estimate. That's marked on both charts. The stock's big move higher came after that report, which fits with the earnings being the main driver.
Recent headlines add a mixed note. The company said it will take part in the Jefferies Global Healthcare Conference, which is a routine investor event. Separately, Stephens downgraded the stock to Equal Weight, a neutral rating that means the analyst sees it as roughly fairly valued rather than a standout pick. The stock also appeared in a broader list of large stocks moving higher on a Wednesday, which is general market noise rather than company-specific news.
What would change this
The read above depends on the rising pattern of higher lows holding. If price breaks below the support level near $58.70, that would break the short-term structure, and the daily chart would no longer show buyers stepping in at higher prices. The weekly uptrend would also be under question if price fell back toward the early-September low, since that's the point where the recent pattern of higher lows would be called into doubt.
On the upside, a daily close above resistance near $85.12 would clear the nearest ceiling and suggest the rally has more room. Failing there, with price dropping back below the most recent swing high, would point to the rally stalling.
Key takeaways
- TXG is up roughly 327% on the weekly chart, closing near $69.75 today.
- Both the weekly and daily charts are moving upward, so the timeframes agree.
- Support sits near $58.70 and resistance near $85.12, with price in between.
- Analyst Stephens cut its rating to Equal Weight, a neutral view, after a strong earnings beat in August.
This one was our pick. The next one is yours.
You've just read the public write-up for TXG. A free account adds the full Pulse Report — the one that normally costs credits — on a symbol you choose, saved to your account and emailed to you.
- One full Pulse Report a week, on any symbol from the published list
- A five-symbol watchlist with live prices and signals
- Earnings dates, analyst targets, news and basic financials for what you follow
- Multi-timeframe charts with the indicators you choose
- Email alerts when something you're watching moves
- Deeper reports in three tiers when you want them — Pulse, Insight and Alpha
No card needed.
Research and education only — not financial advice, and not a recommendation to buy, sell or hold any security. Analysis is generated with AI assistance from measured price data and may contain errors. Prices shown were accurate at the last update. Full terms · How we produce this