ServiceTitan, Inc. (TTAN)
ServiceTitan hit a fresh low of 54.68 this week, down 45% from its peak of 129.26. But the stock just beat earnings by 14% on September 8th, and both the weekly and daily charts are now pointing the same direction: up. The question is whether this bounce has room to run.
The long-term picture
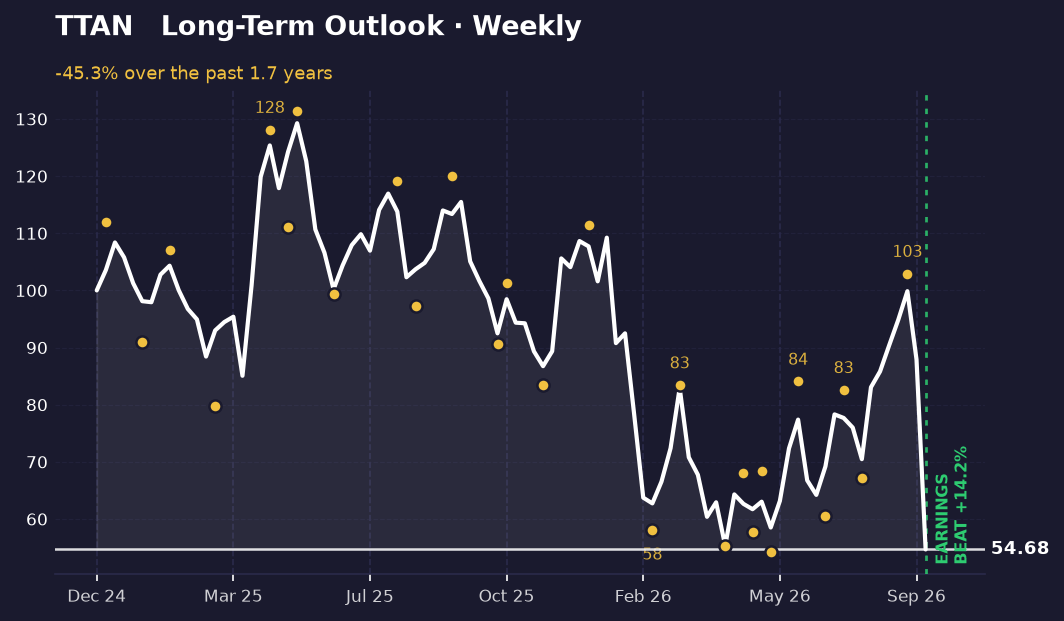
Over the past several months, TTAN has traced a clear pattern of lower lows and lower highs. It started around 100, climbed to 129.26, then fell to 60.51 in late June. A recovery attempt reached 82.62 in mid-July before rolling over to 67.11 at the end of July. The most recent swing high came in at 102.95 on August 28th—a level that matters because it's the highest point the stock has touched since the initial decline began. Right now at 54.68, the stock is at the absolute bottom of its range, having given back all the gains from that August bounce.
The weekly picture shows TTAN is 57.7% below its all-time high on this chart. That's a severe drawdown, but it also means the stock is sitting at support—the lowest close it's recorded in this timeframe. The August 28th high of 102.95 is the nearest resistance above current levels.
The short-term picture
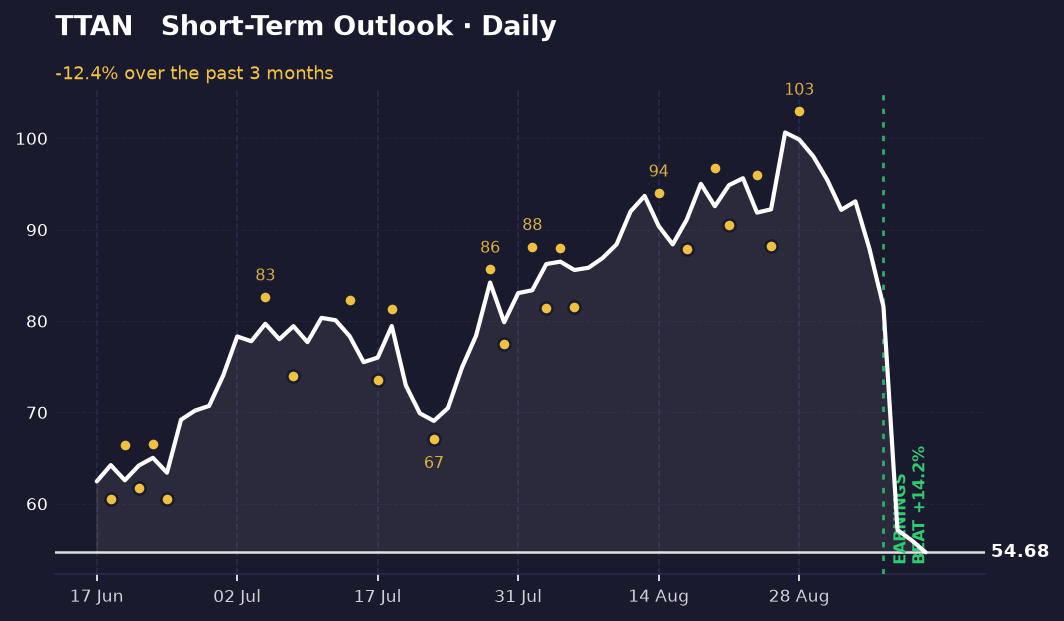
The daily view tells a tighter story. Over the past couple of weeks, the stock has swung between 88.26 and 102.95, with the most recent high hit on August 28th. Since then it's fallen 12.4%, closing at 54.68. That's a sharp drop from the 100.64 level it touched earlier in this period, and it's now at the exact bottom of the daily range.
Here's where the two timeframes align: both the weekly and daily charts are moving in the same direction right now. The earnings beat on September 8th came right as the stock was testing these lows, which could be significant. The nearest resistance sits at that August 28th high of 102.95. A move back above 90.56 (the low from August 21st) would be the first sign that the selling pressure is easing.
What's driving it
ServiceTitan reported earnings on September 8th and beat expectations by 14.23%, a solid result that arrived as the stock was hitting its lows. This is the most concrete catalyst in the data. No other recent news is supplied, so the price action itself—the sharp decline followed by the earnings beat—is what's driving attention right now. The timing of the beat at the bottom of the range could matter if it signals that the selling has exhausted itself.
What would change this
The read above assumes the lows hold and the earnings beat provides a floor. That changes if TTAN closes below 54.68, which would be a new low and would suggest the selling isn't finished. On the upside, a sustained move above 102.95 would confirm that the August high is now acting as a springboard rather than a ceiling—that would mean the bounce has real conviction. Anything between 54.68 and 90.56 is still in the gray zone: the stock would be recovering, but not yet proving the downtrend is broken.
Key takeaways
- TTAN is down 45% from its peak of 129.26 but just beat earnings by 14%, creating a potential inflection point.
- The stock hit 54.68 this week, its lowest close in the measured period, and is now 57.7% below its all-time high.
- Both weekly and daily charts are aligned and pointing upward, with the nearest resistance at the August 28th high of 102.95.
- A break below 54.68 would signal the decline continues; a sustained move above 102.95 would confirm the bounce has legs.
This one was our pick. The next one is yours.
You've just read the public write-up for TTAN. A free account adds the full Pulse Report — the one that normally costs credits — on a symbol you choose, saved to your account and emailed to you.
- One full Pulse Report a week, on any symbol from the published list
- A five-symbol watchlist with live prices and signals
- Earnings dates, analyst targets, news and basic financials for what you follow
- Multi-timeframe charts with the indicators you choose
- Email alerts when something you're watching moves
- Deeper reports in three tiers when you want them — Pulse, Insight and Alpha
No card needed.
Research and education only — not financial advice, and not a recommendation to buy, sell or hold any security. Analysis is generated with AI assistance from measured price data and may contain errors. Prices shown were accurate at the last update. Full terms · How we produce this