Tesla, Inc. (TSLA)
Tesla is up about 24.5% over the past three months, closing at 399.81 most recently. The stock is in a clear rebound, and both the longer and shorter charts point the same way, which is worth understanding before anything else.
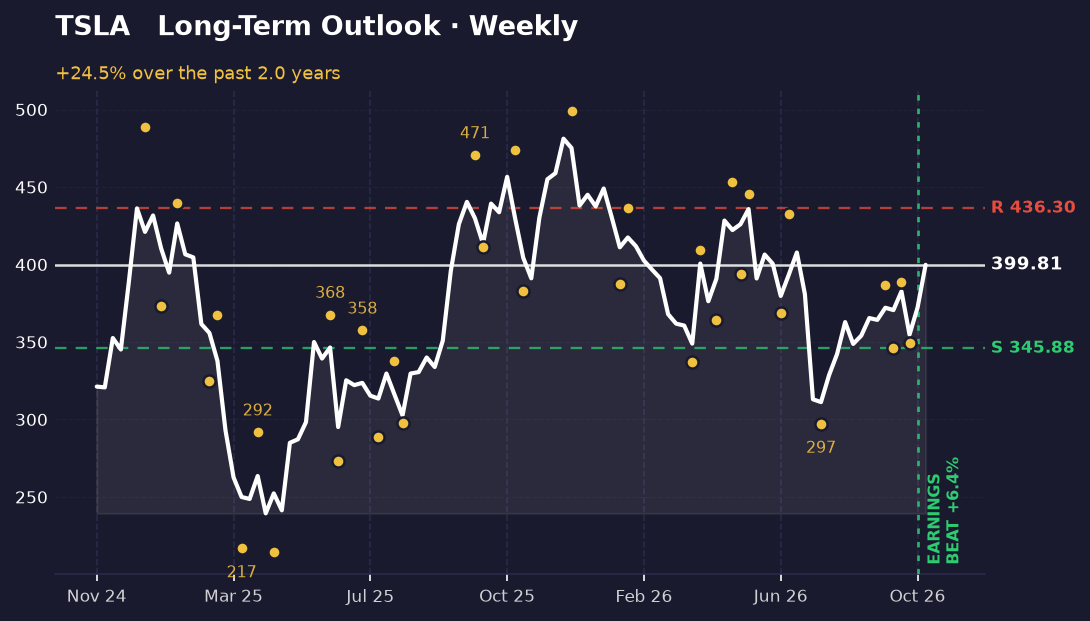
The long-term picture
Look at the weekly chart and you see a stock that fell to a low near 239 and has climbed back since. The highest close in the period was 481.2, so price remains about 16.9% below that peak. The move up has been steady rather than a single spike.
The swings tell the story more clearly. Recent intraday highs came in at 386.83 and 388.56, with lows at 345.88 and 349.33. Each dip has held above the one before it, which is what a rising pattern looks like. The lower level around 345.88 is the support on this chart, and the upper one near 436.3 is the resistance. Price sits about 13.5% above support and roughly 9% below resistance, so it is in the middle of that band, closer to the top.
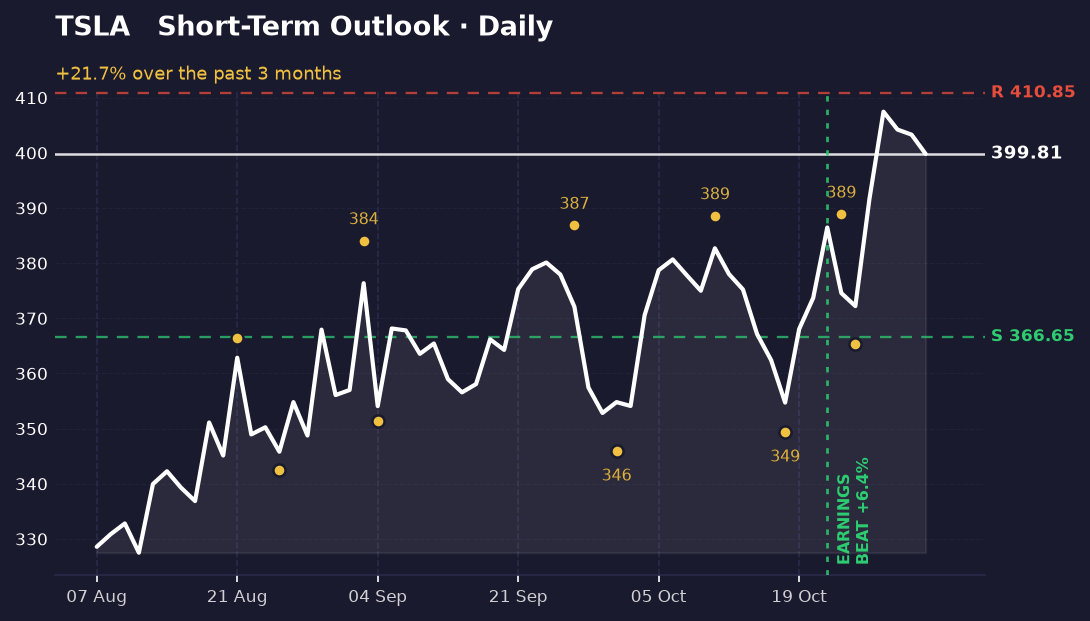
The short-term picture
The daily chart is more recent and more lively. Over the past few weeks the stock has climbed from around 328 to close at 399.81, which is near the top of its closing range for the period. Momentum is pointing up, and it agrees with the weekly picture.
The nearest levels matter here. Support sits at 366.65 and resistance at 410.85. Price is about 2.8% below resistance, so it is close to a ceiling it has not yet cleared on a closing basis. The stock recently pulled back to a low of 365.27 before recovering, which shows buyers stepped in near that zone.
Both timeframes are aligned, so there is no conflict to flag between them.
What's driving it
Tesla reported earnings on October 21, 2026, and beat expectations by 6.4%. That result is marked on both charts, and the rise since has followed it.
In the news, a Bank of America note flagged regulatory hurdles for a possible Tesla and SpaceX merger. Other headlines covered Elon Musk's political activity and robotaxi plans, but none of these is a direct price driver the data can confirm. Broader sector coverage noted that defensive stocks led on a recent Friday while growth names lagged, which is useful context for how the market is treating growth shares generally.
What would change this
The read here is upward and tied to the swing lows. If price falls back below the recent intraday low of 365.27, the short-term picture would weaken, because that would break the pattern of higher lows on the daily chart. Support at 366.65 is the nearer line to watch.
On the weekly chart, a break below 345.88 would undo the rising sequence of lows and change the longer-term view. A close above resistance near 410.85 would be the more constructive signal, and it would bring the 436.3 level into view.
Key takeaways
- Tesla is up about 24.5% over the past three months and closed most recently at 399.81.
- Both the weekly and daily charts are moving upward, so the two timeframes agree.
- Price sits about 2.8% below short-term resistance at 410.85, close to a ceiling it has not yet cleared.
- A break below the recent low of 365.27 would weaken the short-term picture.
This one was our pick. The next one is yours.
You've just read the public write-up for TSLA. A free account adds the full Pulse Report — the one that normally costs credits — on a symbol you choose, saved to your account and emailed to you.
- One full Pulse Report a week, on any symbol from the published list
- A five-symbol watchlist with live prices and signals
- Earnings dates, analyst targets, news and basic financials for what you follow
- Multi-timeframe charts with the indicators you choose
- Email alerts when something you're watching moves
- Deeper reports in three tiers when you want them — Pulse, Insight and Alpha
No card needed.
Research and education only — not financial advice, and not a recommendation to buy, sell or hold any security. Analysis is generated with AI assistance from measured price data and may contain errors. Prices shown were accurate at the last update. Full terms · How we produce this