Seagate Technology Holdings PLC (STX)
Seagate's stock has had a huge run. It closed around $105 at the start of the period we're looking at and about $645 at the end, a gain of more than 500%. But it has pulled back hard lately, and the recent daily chart is pointing down while the longer chart still points up. That disagreement is what makes it worth a closer look.
The long-term picture
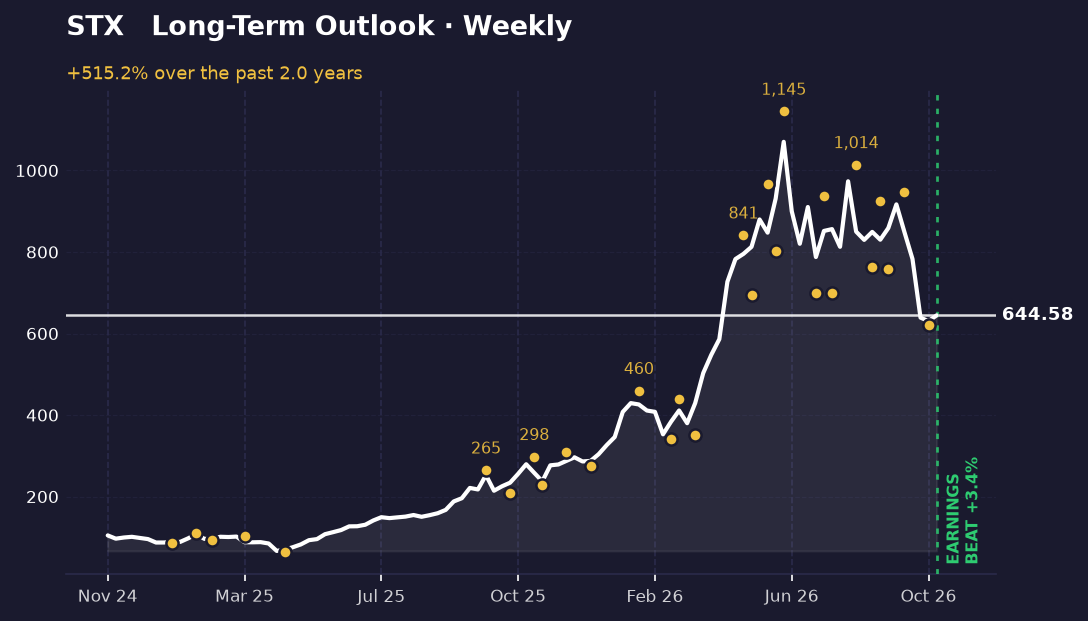
The weekly chart shows the big picture. Over the period, the stock climbed from a low close near $67 to a high close near $1,070, then came back down to where it sits now. That's a long and steep trend, and the stock is still well above where it started.
The swings tell the more recent story. Intraday highs near $925 in mid-September and $946 in early October were followed by lows near $758 and $621. Each rally has peaked a little lower than the one before it, and the most recent low, around $621 in late October, is the lowest point on the recent swing chart. Traders call a pattern like that a lower-high, lower-low structure, which usually means the trend has lost some momentum.
Today's close of about $645 sits roughly 40% below the all-time closing high and about 39% above the lowest close. In plain terms, the stock is in the middle of its long range, not near either end of it.
The short-term picture
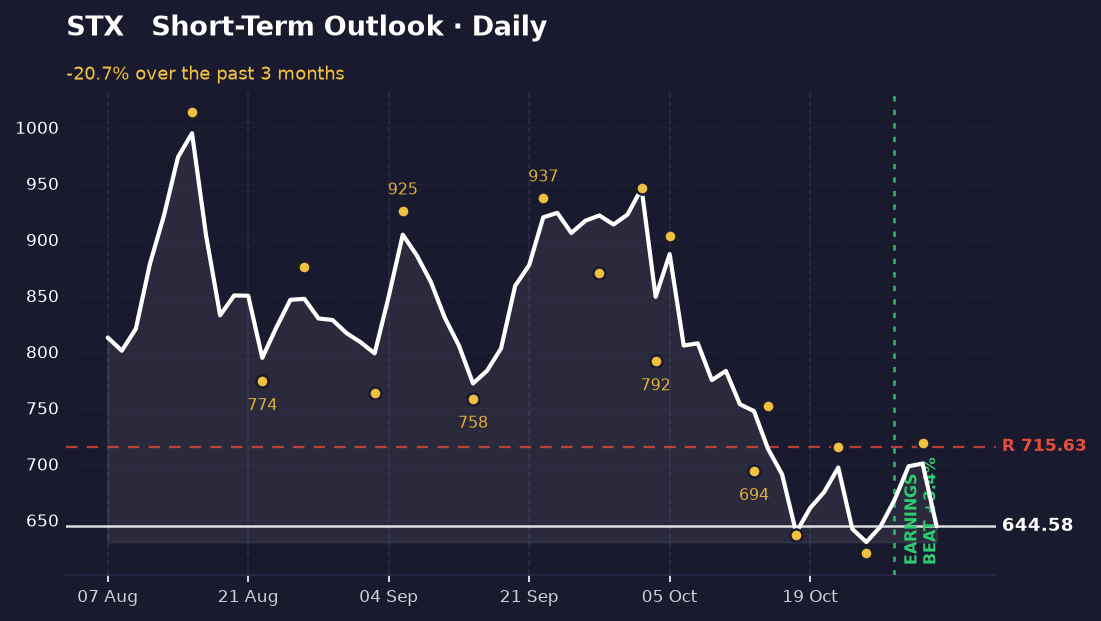
The daily chart is much weaker. Over the last stretch of trading, the stock fell about 21%, from roughly $813 to $645. It closed near the bottom of its recent range, sitting only about 2% above the lowest close, which tells you sellers have been in control.
The short-term and long-term views disagree. The weekly chart still reflects a strong multi-month uptrend, while the daily chart shows a sharp recent drop. When two timeframes point in opposite directions, the short-term move may be a pause within the bigger trend, or it may be the start of a bigger correction. The charts alone don't say which.
The nearest level that matters on the daily chart is resistance around $716, the intraday high from October 21. The stock would need to rise about 11% from here to reach it. Until it does, the daily picture stays weak.
What's driving it
Seagate reported its most recent quarterly earnings on October 27, 2026, and beat expectations by about 3.4%. The stock didn't rally on the news, which suggests the market was already expecting a good result or is focused on other concerns.
The recent headlines are a mix. One reports that Seagate posted a statutory profit. Others cover the broader chip and memory sector, including reports that memory makers are seeing strong profits while their shares remain far below previous highs. None of the headlines tie the recent drop to a specific negative event, so the decline looks more like a sector-wide and sentiment-driven selloff than a company-specific problem.
What would change this
The weekly read changes if the stock breaks below the late-October low near $621. That would confirm the lower-high, lower-low pattern and suggest the longer uptrend is weakening, not just pausing.
The daily read changes if the stock closes above resistance near $716. A move through that level would show buyers are returning and would bring the short-term chart into line with the long-term one. Until then, the short-term weakness stands.
Key takeaways
- Seagate's stock rose more than 500% over the period but is about 40% below its highest close.
- The weekly chart shows lower highs and a recent low near $621, which signals fading momentum.
- The daily chart is weak, falling about 21% and sitting near its recent lows.
- The daily chart needs to clear resistance near $716 to suggest the short-term decline is ending.
This one was our pick. The next one is yours.
You've just read the public write-up for STX. A free account adds the full Pulse Report — the one that normally costs credits — on a symbol you choose, saved to your account and emailed to you.
- One full Pulse Report a week, on any symbol from the published list
- A five-symbol watchlist with live prices and signals
- Earnings dates, analyst targets, news and basic financials for what you follow
- Multi-timeframe charts with the indicators you choose
- Email alerts when something you're watching moves
- Deeper reports in three tiers when you want them — Pulse, Insight and Alpha
No card needed.
Research and education only — not financial advice, and not a recommendation to buy, sell or hold any security. Analysis is generated with AI assistance from measured price data and may contain errors. Prices shown were accurate at the last update. Full terms · How we produce this