TD SYNNEX Corporation (SNX)
TD SYNNEX has climbed 121% from its low of $95.81, and just beat earnings by 20.8% on September 24th. But the stock is caught between two conflicting signals: the weekly chart shows strength near all-time highs, while the daily chart has lost momentum and is sitting in the middle of its recent range. That disagreement is worth understanding.
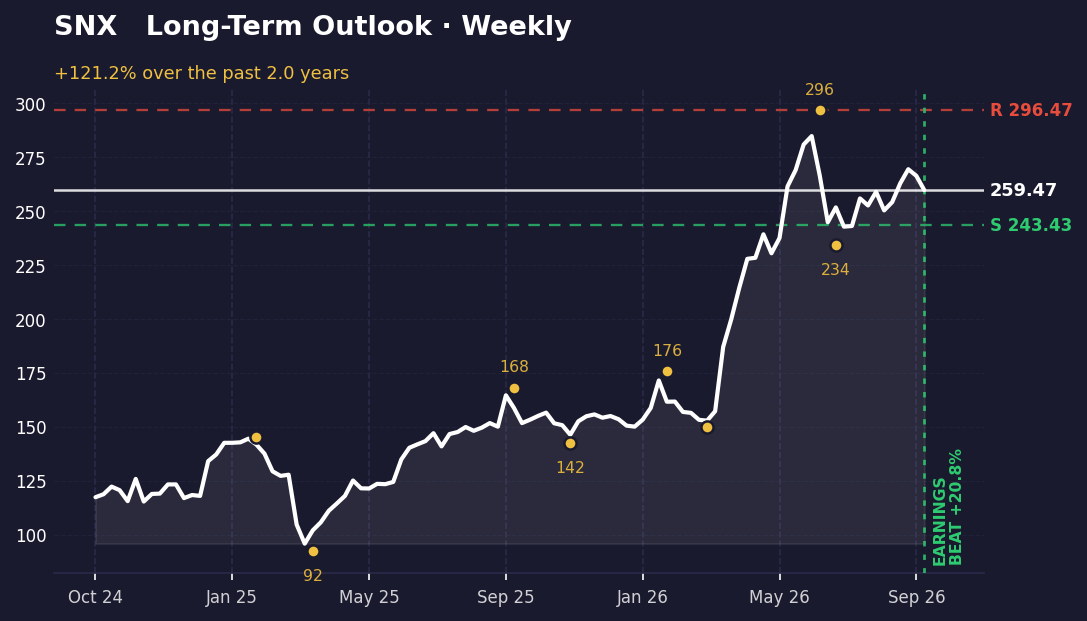
The long-term picture
Over the past year, SNX has built a clear uptrend. The stock bottomed at $95.81, rallied to $175.56 in February, pulled back to $150, then accelerated sharply to a high of $296.47 in late June. Since then it's consolidated between $234.03 and $296.47, with the current close of $259.47 sitting 6.2% above the support level of $243.43 and 14.3% below the resistance at $296.47. The stock is in the upper half of its closing range — 86.7% of the way from its low to its high — which reflects the overall strength of the move.
The weekly picture is constructive. Price is holding well above the recent swing low of $234.03 and has room to run toward the $296.47 high. Support is solid at $243.43. The earnings beat on September 24th, combined with headlines about sustained data center demand, aligns with this uptrend.
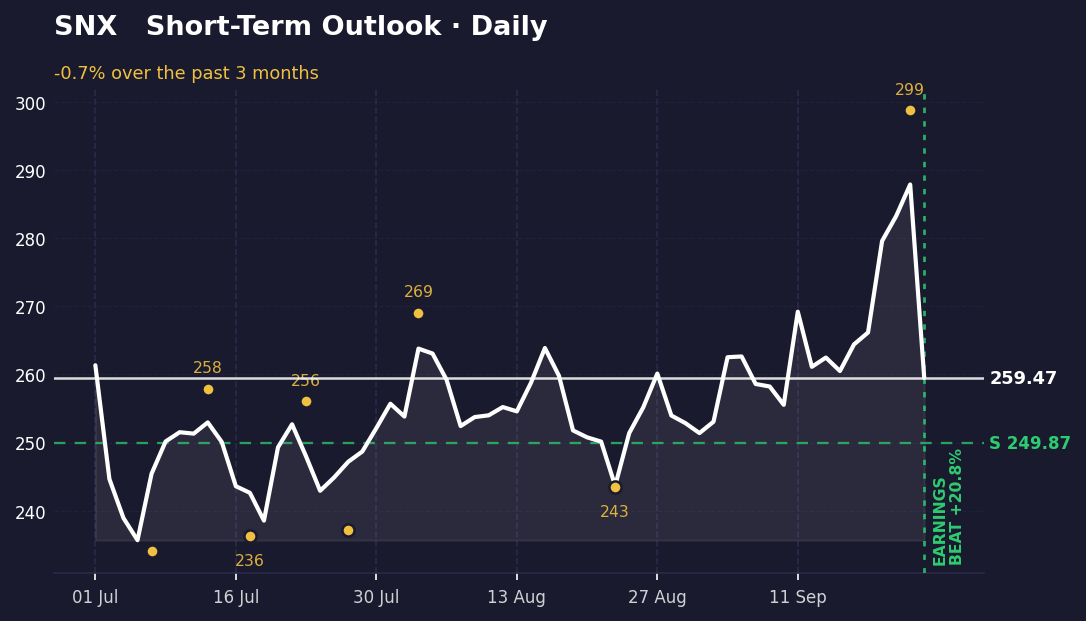
The short-term picture
The daily chart tells a different story. Over the past month, SNX has swung from a low of $237.21 to a high of $298.77, but the most recent action shows weakness. Price is now at $259.47, sitting in the middle of its daily range at 45.6% — neither near the highs nor the lows. The stock is only 3.7% above the daily support of $249.87, which is tighter than the weekly picture suggests.
This is where the conflict matters. The weekly chart is bullish and near resistance; the daily chart has lost upside momentum and is sitting neutral in the middle of its range. The earnings beat happened on September 24th, right at the daily high of $298.77, but price has drifted lower since. If the daily momentum doesn't recover, the weekly uptrend could stall. Watch whether price can reclaim the $269.01 level — the recent daily high from August 4th — or whether it rolls over toward the $249.87 support.
What's driving it
TD SYNNEX reported Q3 2026 earnings on September 24th, beating expectations by 20.8%. The company's commentary on data center demand — specifically that it "isn't cracking" — supports the longer-term bullish narrative. The stock spiked to $298.77 on the earnings announcement, but has since retreated. No other near-term catalysts are evident from the supplied headlines, which focus on broader market moves and geopolitical factors rather than company-specific news.
What would change this
The weekly bullish case breaks if price closes below the support level of $243.43. That would signal the recent consolidation has failed and could trigger a retest of the $234.03 swing low. Conversely, the daily weakness becomes irrelevant if SNX reclaims and holds above $269.01 — the recent daily high from August 4th — which would restore momentum toward the $296.47 resistance and confirm the weekly uptrend is intact. The next few days will show whether the earnings beat has real follow-through or whether it was a one-day spike.
Key takeaways
- SNX is up 121% from its low but faces conflicting signals: weekly chart is bullish near resistance, daily chart has lost momentum and sits neutral in its range.
- The stock is only 3.7% above daily support at $249.87, tighter than the 6.2% cushion above weekly support at $243.43.
- Earnings beat 20.8% on September 24th, but price has drifted lower since the spike to $298.77, suggesting the move may lack conviction.
- The $269.01 level is the key to watch: reclaiming it would restore daily momentum and align with the weekly uptrend; breaking below $249.87 would invalidate both.
This one was our pick. The next one is yours.
You've just read the public write-up for SNX. A free account adds the full Pulse Report — the one that normally costs credits — on a symbol you choose, saved to your account and emailed to you.
- One full Pulse Report a week, on any symbol from the published list
- A five-symbol watchlist with live prices and signals
- Earnings dates, analyst targets, news and basic financials for what you follow
- Multi-timeframe charts with the indicators you choose
- Email alerts when something you're watching moves
- Deeper reports in three tiers when you want them — Pulse, Insight and Alpha
No card needed.
Research and education only — not financial advice, and not a recommendation to buy, sell or hold any security. Analysis is generated with AI assistance from measured price data and may contain errors. Prices shown were accurate at the last update. Full terms · How we produce this