Super Micro Computer, Inc. (SMCI)
Super Micro Computer closed at $29.60 on the latest session, well off its recent high of $44.94 and about 59% above where the weekly chart began. The longer picture has been climbing while the last few weeks have turned lower, which makes this one worth a closer look.
The long-term picture
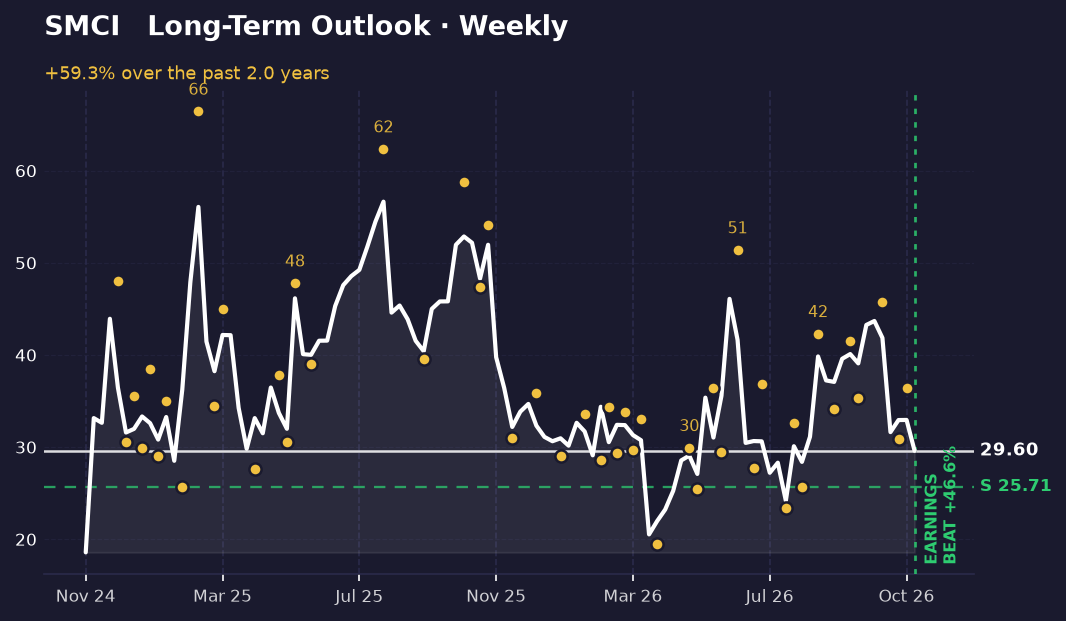
Over the past several months, the weekly chart shows a stock that has moved strongly higher. The price started near $18.58 and reached a closing high of $56.64 at its peak, then fell back sharply. Price is now about 48% below that high but still roughly 59% above its lowest close.
The weekly swings tell the same story in more detail. Recent swing lows came in at $35.36 in mid-September and $30.92 in late October, while swing highs reached $45.77 in early October and $36.40 at the end of October. Each low so far has sat above the one before it, and that pattern is what traders call an uptrend, meaning a series of higher lows.
A support level is a price where buyers have tended to step in. On the weekly chart, support sits at $25.71, and the current price is about 13% above it. Nothing on this chart marks a clear resistance level above the current price.
The short-term picture
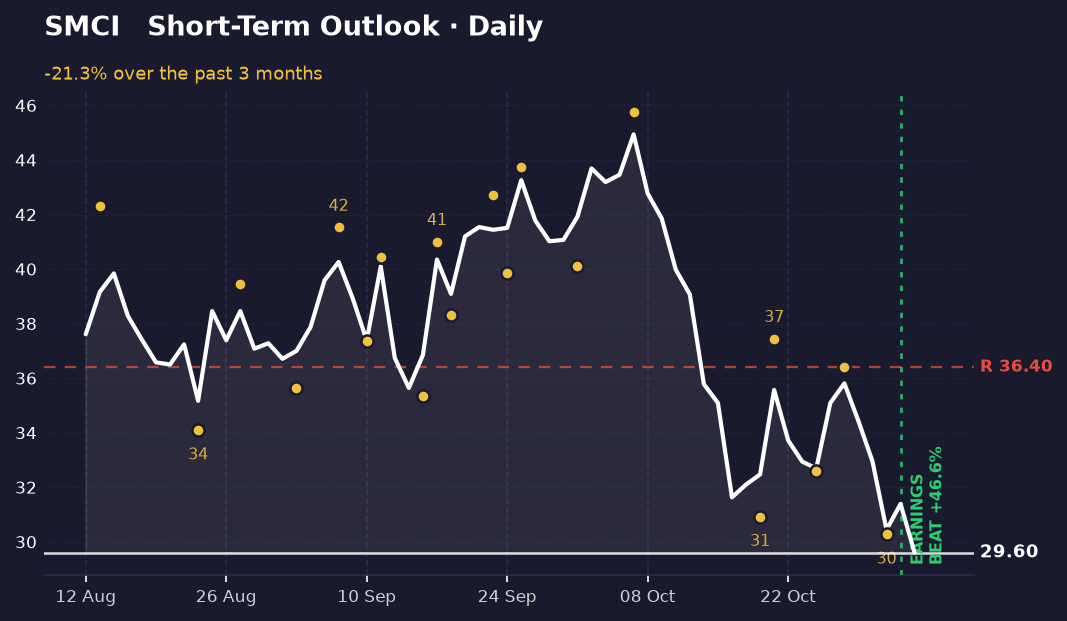
The daily chart looks much weaker. Over the recent stretch, the stock fell about 21%, from roughly $37.61 down to $29.60, and it is sitting at the bottom of its recent closing range. That means today's close is near the lowest point of the period shown.
This is where the two timeframes disagree. The weekly chart points up, while the daily chart points down. Short-term moves often run against the longer trend for a while, so the disagreement does not settle which one will win.
The nearest level on the daily chart is resistance at $36.40, about 23% above the current price. Price would need to climb back to that area to repair the short-term damage. On the downside, no clear daily support is marked, so the last few swing lows near $30 are the closest reference points.
What's driving it
Super Micro reported quarterly results on November 3, and the company beat expectations by about 47%. The chart marks that date with a vertical line. The stock's daily decline came after that report, so the beat did not translate into a sustained rally.
Recent headlines point to analyst activity and business concentration. One analyst raised its price target to $39 while keeping an underperform rating, meaning it expects the stock to lag the market. Another headline notes that one customer accounts for about 44% of sales, which concentrates the company's revenue in a single buyer. Both items are worth weighing alongside the chart.
What would change this
The longer-term read depends on the higher lows holding. A close below the $25.71 support level would break the pattern of rising lows and would suggest the weekly uptrend is ending. The weekly picture would then point to a much weaker stock.
The short-term read changes if the stock reclaims $36.40. A daily close above that level would reverse the recent decline and bring the two timeframes closer into agreement. Failing to get there, with the price staying below it, would keep the short-term picture negative.
Key takeaways
- Super Micro's weekly chart shows a rise of about 59% over the period, with higher lows so far.
- The daily chart has fallen about 21% recently and sits at the bottom of its recent range.
- The weekly and daily views conflict, with the longer trend up and the short-term trend down.
- A close below $25.71 would break the weekly uptrend, while a move above $36.40 would ease the short-term pressure.
This one was our pick. The next one is yours.
You've just read the public write-up for SMCI. A free account adds the full Pulse Report — the one that normally costs credits — on a symbol you choose, saved to your account and emailed to you.
- One full Pulse Report a week, on any symbol from the published list
- A five-symbol watchlist with live prices and signals
- Earnings dates, analyst targets, news and basic financials for what you follow
- Multi-timeframe charts with the indicators you choose
- Email alerts when something you're watching moves
- Deeper reports in three tiers when you want them — Pulse, Insight and Alpha
No card needed.
Research and education only — not financial advice, and not a recommendation to buy, sell or hold any security. Analysis is generated with AI assistance from measured price data and may contain errors. Prices shown were accurate at the last update. Full terms · How we produce this