Shopify Inc. (SHOP)
Shopify is sitting at $142.57, well up on where it was a few months ago but lower than it was just a couple of weeks back. The longer chart and the shorter chart are pointing in different directions, which is why it's worth a closer look. Here's what each one shows.
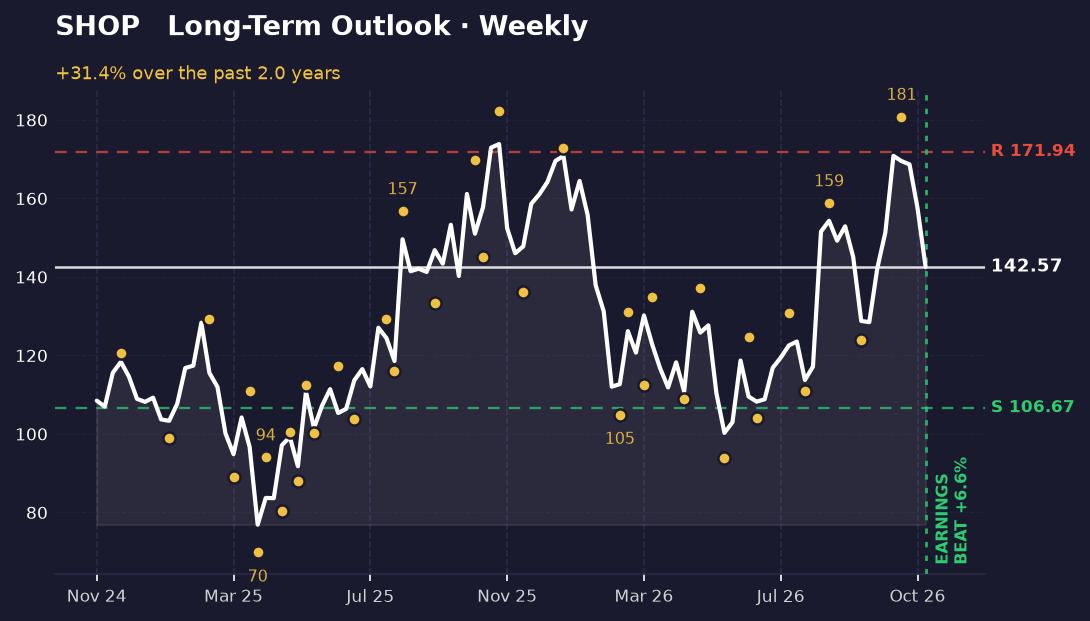
The long-term picture
Looking at the weekly chart, the bigger picture is still upward. Over the period shown, the stock closed up 31.4%, from $108.49 to $142.57. It has made a series of higher lows and higher highs, with the most recent intraday peak at $180.88 in mid-October and a low of $111.06 in late July.
The current price sits about two-thirds of the way up its closing range, which puts it in the upper half of where it has traded. It is still 25.2% above the support level of $106.67, the price floor the stock has bounced from. It is also 20.6% below resistance at $171.94, the ceiling where selling has repeatedly stopped gains.
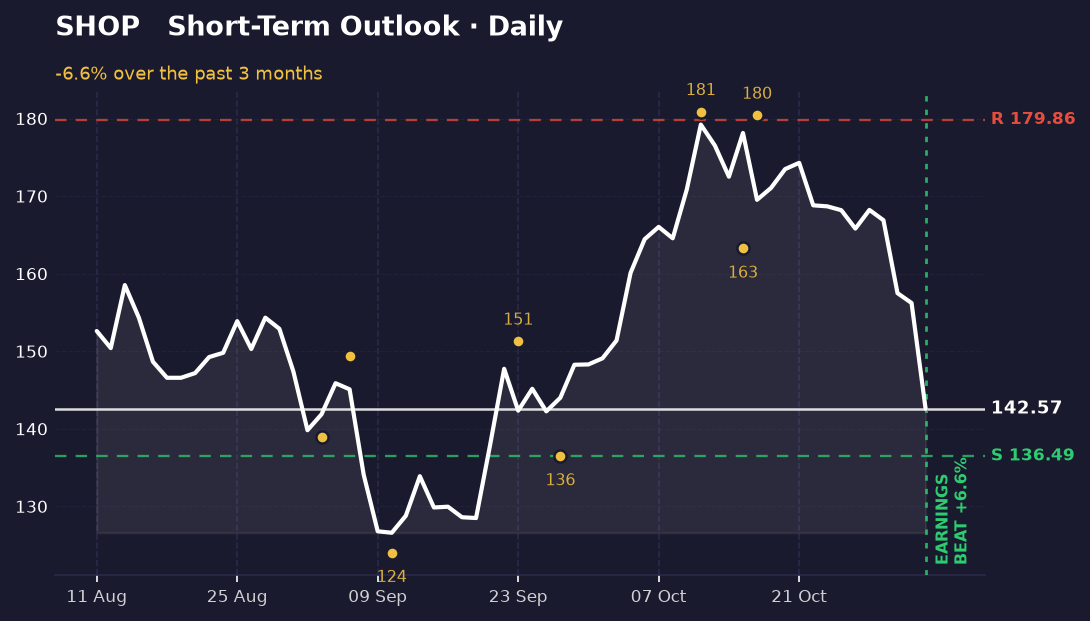
The short-term picture
The daily chart tells a different story. Over the last few sessions the stock fell 6.6%, from $152.61 to $142.57, and it is now about 20% below its recent closing high of $179.22. Momentum has turned down, and the price sits in the lower third of its recent range.
The two timeframes disagree. The weekly view says the trend is still up, while the daily view says the stock is in a pullback. Neither one cancels the other, and a reader should keep both in mind.
The nearest level that matters on this chart is support at $136.49, which is only about 4.3% below the current price. A move down to that area would test whether the recent low holds. Resistance on the daily chart sits at $179.86, a long way above.
What's driving it
Shopify reported third-quarter 2026 results on November 3, and the numbers beat expectations by 6.57%. Revenue rose 32% in the quarter, and management pointed to AI-driven commerce as a driver during the earnings call. The company also repurchased $562 million of its shares in the quarter and still has $2.52 billion left under a $5 billion buyback authorisation.
One headline describes the stock sinking on a Tuesday, though the reason given is not clear from the data here. Separately, Shopify filed a shelf prospectus, which is a standard document that lets a company raise money later through stock, debt or other securities. No terms were disclosed, so it is a filing rather than a sale.
What would change this
The long-term read stays intact as long as the weekly chart holds above its support near $106.67. A weekly close below that level would break the pattern of higher lows and would suggest the uptrend has ended.
On the daily chart, the key line is $136.49. If the stock falls through it, the short-term pullback would be turning into a deeper decline, and the weekly and daily views would start to agree on the downside. A recovery back above the recent high near $180 would instead mean the daily pullback was just a pause.
Key takeaways
- Shopify is up 31.4% over the weekly chart period, from $108.49 to $142.57.
- The stock fell 6.6% over the last few daily sessions, so short-term momentum has turned down.
- The weekly trend is up and the daily trend is down, and the two charts currently disagree.
- The nearest support on the daily chart is $136.49, about 4.3% below the current price.
This one was our pick. The next one is yours.
You've just read the public write-up for SHOP. A free account adds the full Pulse Report — the one that normally costs credits — on a symbol you choose, saved to your account and emailed to you.
- One full Pulse Report a week, on any symbol from the published list
- A five-symbol watchlist with live prices and signals
- Earnings dates, analyst targets, news and basic financials for what you follow
- Multi-timeframe charts with the indicators you choose
- Email alerts when something you're watching moves
- Deeper reports in three tiers when you want them — Pulse, Insight and Alpha
No card needed.
Research and education only — not financial advice, and not a recommendation to buy, sell or hold any security. Analysis is generated with AI assistance from measured price data and may contain errors. Prices shown were accurate at the last update. Full terms · How we produce this