QUALCOMM Incorporated (QCOM)
QUALCOMM closed at $164.79, down about 3.6% over the past three months and about 1.8% over the past several weeks on the daily chart. Both timeframes point the same way, which is down, but the stock is still well inside a wide range, so the picture is more mixed than the headline numbers suggest.
The long-term picture
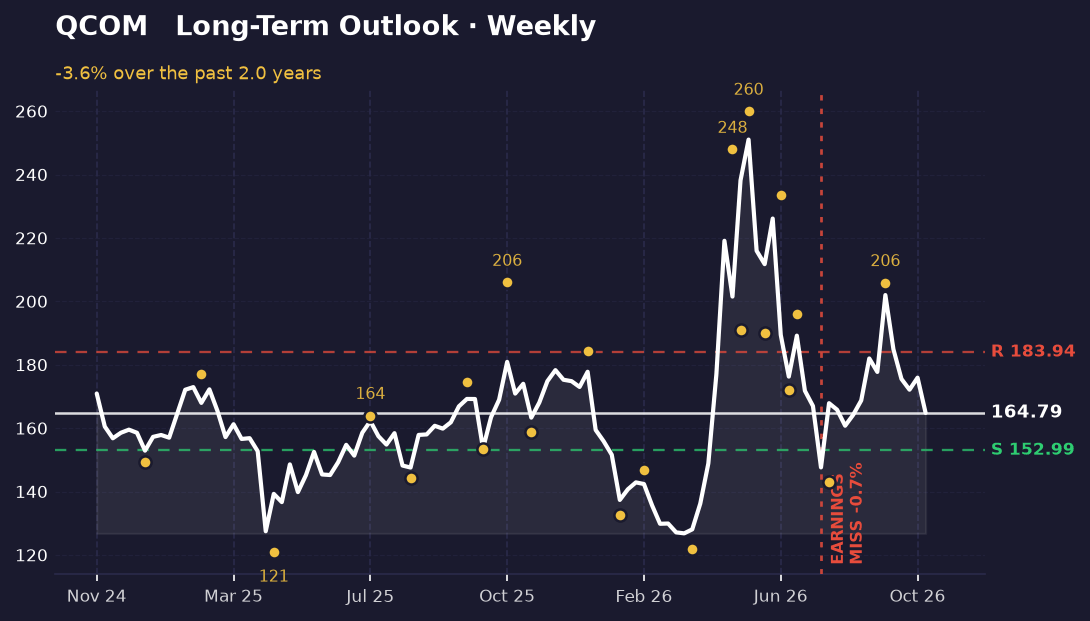
On the weekly chart, the bigger picture is a stock that has swung hard. The highest close in the window was $251.02, and the lowest was $126.80. Price has come down a long way from that peak, about 34% below it, but it is also roughly 30% above the low.
The swing points tell the story more clearly. An intraday high of $196.09 in early July was followed by a low of $142.89 in early August. Then the stock rallied to an intraday high of $205.85 in late September, which is the most recent peak on this chart. From there it has pulled back.
Right now price sits about 7% above a support level near $152.99 and about 12% below resistance near $183.94. Those two levels frame the weekly range: a floor that has held recently, and a ceiling that price has not been able to clear.
The short-term picture
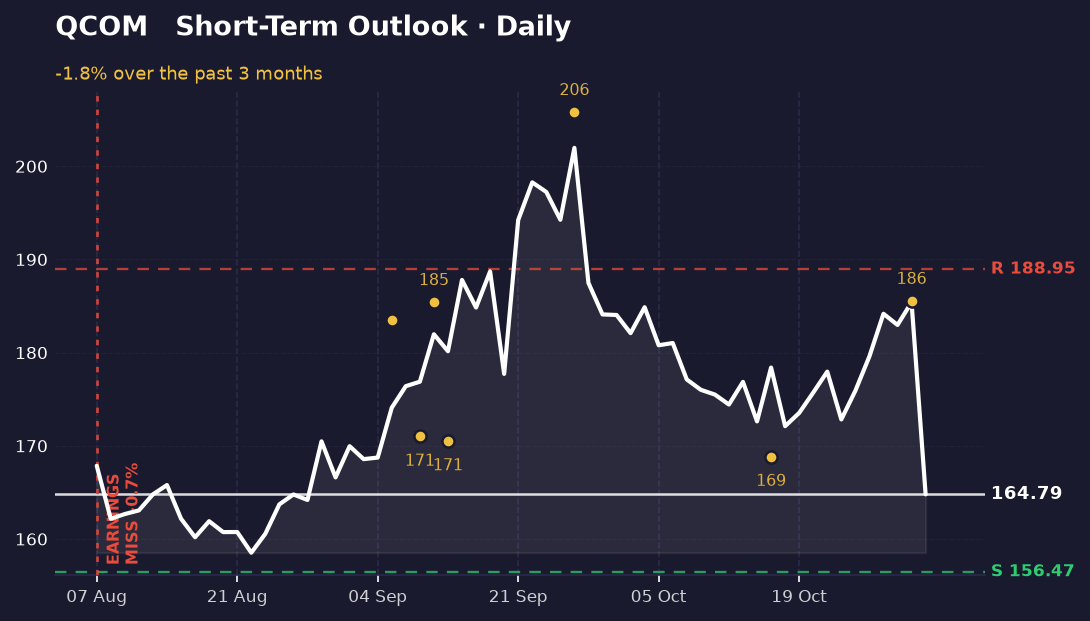
The daily chart shows the same downward lean, but over a shorter stretch. Price has slipped from a high of $201.97 down to a low of $158.53, and the latest close of $164.79 sits near the bottom of that band, about 14% of the way up from the low.
Recent swings on this chart are a low of $170.51 in mid-September, a peak of $205.85 in late September, a low of $168.84 in mid-October, and a high of $185.59 at the end of October. The most recent high is lower than the late-September peak, and price is now below the low of mid-October, which is the kind of lower-high, lower-low pattern that usually signals a downtrend.
The nearest levels are support near $156.47, about 5% below the current price, and resistance near $188.95, about 15% above it. Because the daily picture and the weekly picture agree, the short-term move is not pulling against the longer trend.
What's driving it
QUALCOMM reported earnings on July 29, 2026, and missed expectations by about 0.74%. The miss is marked on both charts. Following that report, the stock moved through a sharp rally and then a pullback, so the earnings date sits in the middle of the recent swings rather than at the start of a new move.
The most recent headlines are mostly about the wider market. A broad tech sell-off, with the Nasdaq falling more than 3% and chip stocks sinking, is the clearest outside pressure on the stock. One headline also mentions a labour union warning strike at a Qualcomm subsidiary in Munich. No headline in the set ties that strike to a measurable change in the company's results, so it is worth noting as background rather than a direct driver of price.
What would change this
The current read is a downtrend. The weekly picture would start to look different if price closed back above the resistance near $184, and especially if it climbed past the late-September high near $206. Holding above that level would break the pattern of lower highs.
On the downside, a close below the weekly support near $153 would be the more worrying signal, since it would take price below the floor that has held through recent swings. On the daily chart, a move back above $189 would be the first sign that short-term momentum is turning up.
Key takeaways
- QCOM closed at $164.79, down about 3.6% over three months, and both the weekly and daily charts point down.
- The most recent swing high on the daily chart, near $186, sits below the late-September peak near $206, a lower-high pattern.
- Support sits near $153 on the weekly chart and resistance near $184, and price is currently between them.
- QUALCOMM missed earnings expectations by about 0.74% on July 29, 2026, and the broader tech sell-off is the strongest outside pressure in recent headlines.
This one was our pick. The next one is yours.
You've just read the public write-up for QCOM. A free account adds the full Pulse Report — the one that normally costs credits — on a symbol you choose, saved to your account and emailed to you.
- One full Pulse Report a week, on any symbol from the published list
- A five-symbol watchlist with live prices and signals
- Earnings dates, analyst targets, news and basic financials for what you follow
- Multi-timeframe charts with the indicators you choose
- Email alerts when something you're watching moves
- Deeper reports in three tiers when you want them — Pulse, Insight and Alpha
No card needed.
Research and education only — not financial advice, and not a recommendation to buy, sell or hold any security. Analysis is generated with AI assistance from measured price data and may contain errors. Prices shown were accurate at the last update. Full terms · How we produce this