PayPal Holdings, Inc. (PYPL)
PayPal closed at $57.01, down about 31% over the period we're looking at. Both the longer weekly picture and the shorter daily picture are pointing down right now, which is why the stock is worth a closer look.
The long-term picture
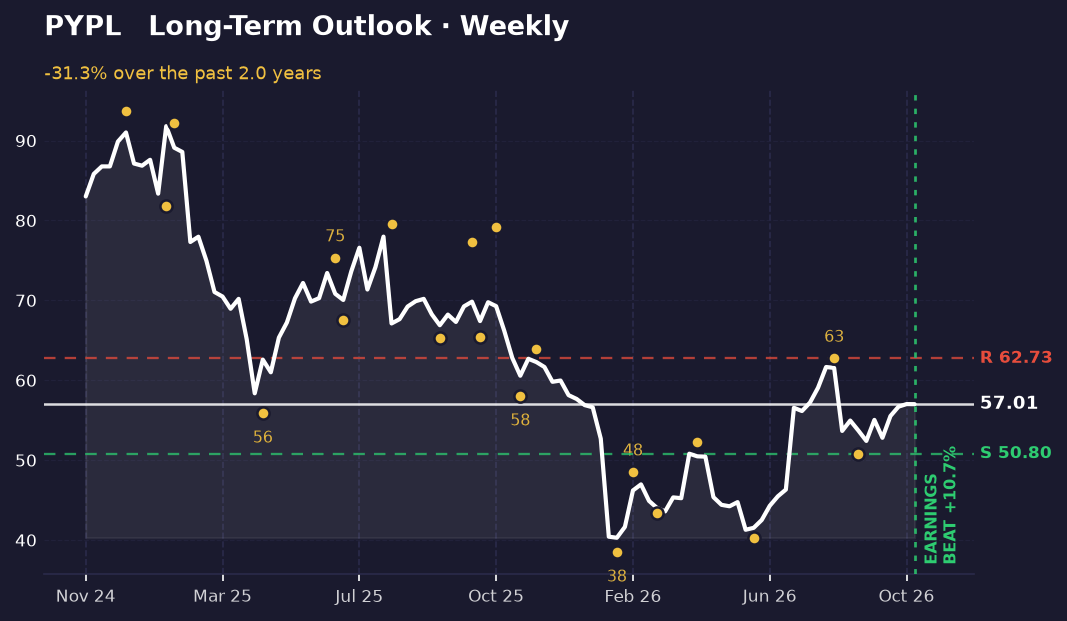
On the weekly chart, PayPal has been in a clear downtrend. It started the stretch at $83.01 and has fallen to $57.01. The high point was $91.81 at the top of the closing range, and the low was $40.29, so the stock sits about a third of the way up that range.
The swings tell the story more clearly than the endpoints do. Price made a high of $52.30 in late April, dropped to $40.20 in June, then rallied to $62.73 in late August before falling back to $50.80 in mid-September. That sequence of lower lows after a fall is what a downtrend looks like on this timeframe. The recent rally has not yet pushed the stock back above its earlier highs in a convincing way.
Right now the stock sits about 11% above the $50.80 support level and about 10% below resistance at $62.73. It's in the middle of the recent range, not at either edge.
The short-term picture
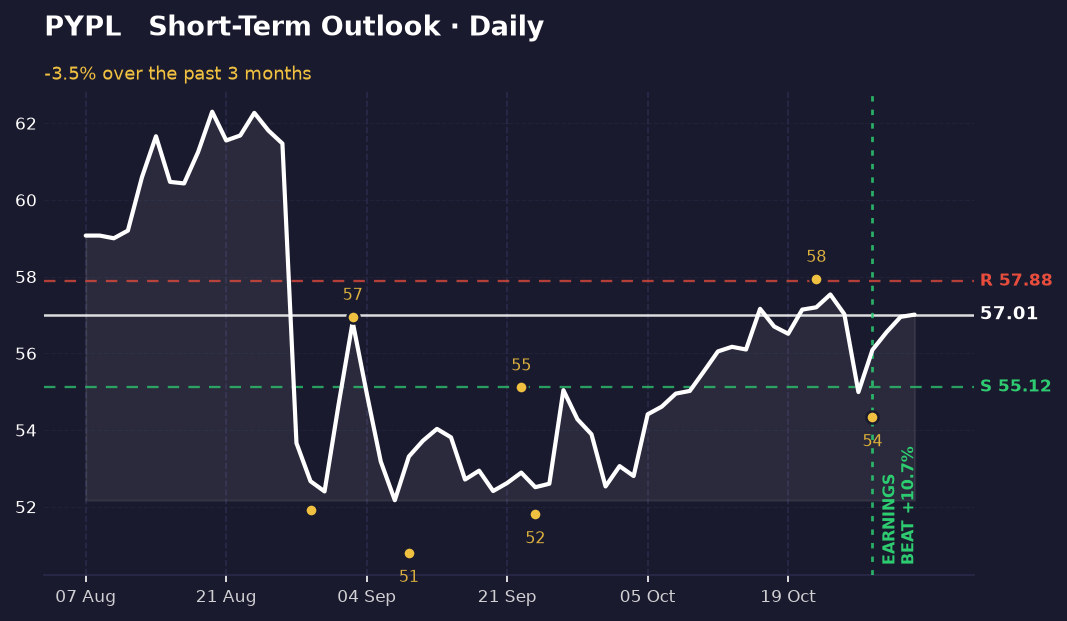
The daily chart tells a shorter, more recent story. Over the past few weeks the stock fell from around $59 to $57.01, a drop of about 3.5%. The stock peaked at $62.30 on the closing side and bottomed at $52.17 in the wider range, so it's sitting roughly halfway between those two points.
The daily trend is moving the same way as the weekly one. Both point down, so the two timeframes agree. The daily swings show a high at $55.12 in late September, a low at $51.81 the next day, a rebound to $57.95 in late October, and a dip to $54.34 a week later. Each rebound has so far stalled a little short of the one before it, which is a sign buyers are running out of steam.
The nearest levels to watch are support at $55.12, about 3% below the current price, and resistance at $57.88, about 1.5% above it. Price is squeezed between them.
What's driving it
PayPal reported earnings on October 27, 2026, and beat expectations by about 10.7%. The stock traded up around that report, and the chart marks the date with a labelled line on both timeframes. The beat has not been enough on its own to reverse the weekly downtrend.
The headlines in recent weeks lean negative for the stock's outlook. Barclays downgraded PayPal to Underweight and cut its price target to $53. UBS kept a Neutral rating but lowered its target to $60. Citigroup also kept a Neutral rating while lowering its target. Separately, PayPal's SVP and CTO, Jon Southall, is leaving for Convera. Analyst cuts and a senior departure are the main things weighing on sentiment here, alongside the broader downtrend.
What would change this
The read above turns more negative if the stock closes below the $50.80 weekly support. That would break the September low and confirm the lower-lows pattern on the longer chart, with the June low at $40.20 as the next major area to watch.
The picture improves if price closes above the $62.73 weekly resistance, which is the late-August high. A close above that level would break the sequence of lower highs and would be the first real sign the downtrend is losing ground. On the daily chart, a clean move above $57.88 would be the first short-term sign that the recent bounce is gaining strength.
Key takeaways
- PayPal is down about 31% over the period shown, from $83.01 to $57.01, and the weekly trend is still lower.
- The stock has been making lower highs, with the late-August rally peaking at $62.73 and the daily bounce stalling near $57.88.
- The most recent earnings beat by about 10.7%, but analyst downgrades and a senior executive departure have kept the outlook cautious.
- A close below $50.80 on the weekly chart would signal the downtrend is extending; a close above $62.73 would be the first real sign of a reversal.
This one was our pick. The next one is yours.
You've just read the public write-up for PYPL. A free account adds the full Pulse Report — the one that normally costs credits — on a symbol you choose, saved to your account and emailed to you.
- One full Pulse Report a week, on any symbol from the published list
- A five-symbol watchlist with live prices and signals
- Earnings dates, analyst targets, news and basic financials for what you follow
- Multi-timeframe charts with the indicators you choose
- Email alerts when something you're watching moves
- Deeper reports in three tiers when you want them — Pulse, Insight and Alpha
No card needed.
Research and education only — not financial advice, and not a recommendation to buy, sell or hold any security. Analysis is generated with AI assistance from measured price data and may contain errors. Prices shown were accurate at the last update. Full terms · How we produce this