PTC Inc. (PTC)
PTC is up 56% over the past few weeks and just hit a new high at $193.60. The stock is running into resistance around $203, and while both the weekly and daily charts show the same upward momentum, analyst opinions are split between neutral and downgrade calls.
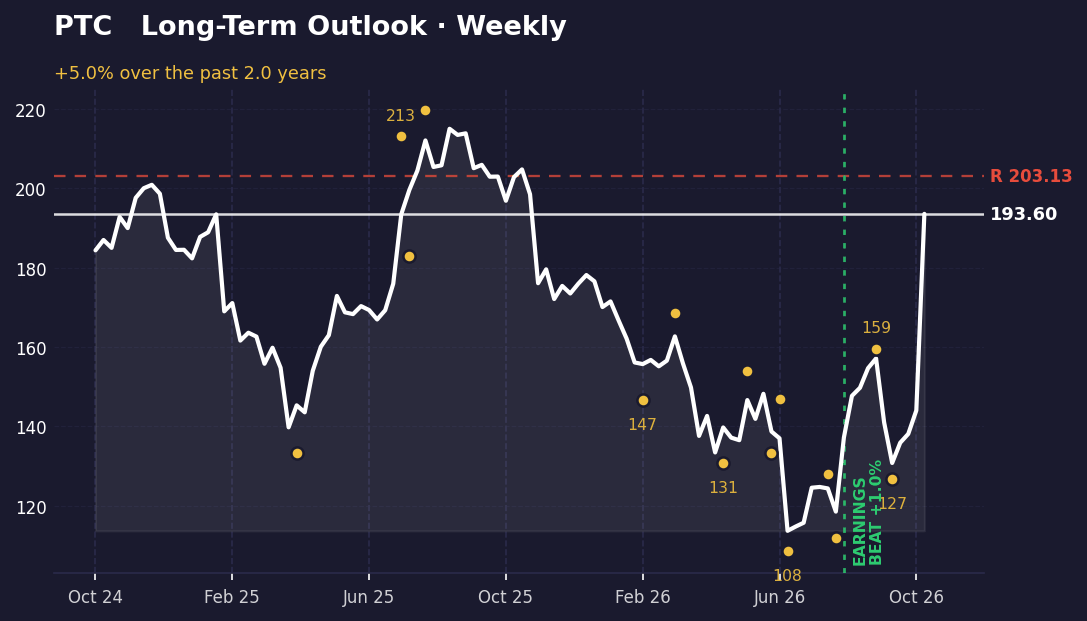
The long-term picture
Over the past several months, PTC has climbed from a low of $113.68 to $193.60, a move that places it 70% above that bottom and 10% below its all-time high of $215.05. The stock sits near the top of its range — at the 79th percentile of its closing prices over this period. The weekly chart shows a clear uptrend punctuated by two major swings: a high of $159.46 in late August, a pullback to $126.79 in mid-September, then a recovery that's now testing the $203 resistance level.
This resistance at $203 is the nearest obstacle to further gains. The stock is currently 4.9% below it, so a break above that level would signal continuation of the rally. Until then, the uptrend remains intact but constrained.
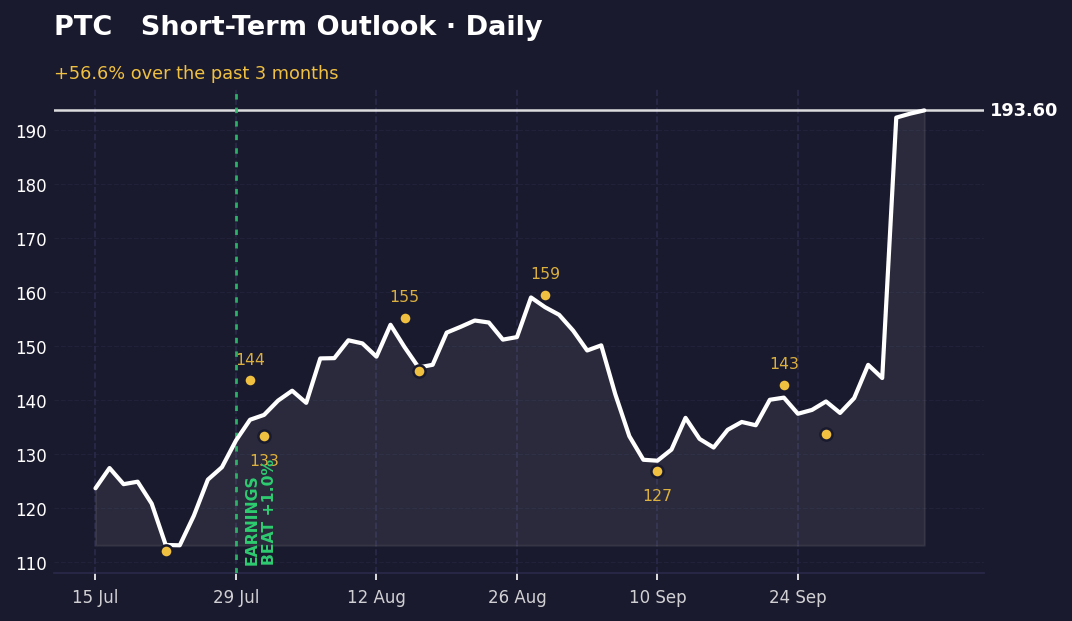
The short-term picture
The daily picture is even more aggressive. PTC has climbed 56.6% from $123.61 to $193.60, and it's now sitting at the absolute top of its recent range — at the 100th percentile of daily closes. The most recent swings show a high of $159.46 in late August, a dip to $126.79 in early September, a bounce to $142.81 in late September, and a low of $133.67 just days ago. From that low, the stock has rallied sharply to new highs.
The daily and weekly views are aligned — both show upward momentum with no conflict. However, the daily chart offers no resistance level yet, meaning the stock is in uncharted territory above its recent swing highs. This makes the $203 weekly resistance level the key test ahead.
What's driving it
PTC beat earnings on July 29 by 0.98%, a modest surprise that marked the start of this rally. Since then, analyst activity has been mixed. Citigroup, JP Morgan, and Mizuho have all raised their price targets to $205 while maintaining neutral ratings, suggesting they see limited upside from current levels. Oppenheimer, however, downgraded the stock to Perform, signaling caution. The $205 target from three major banks sits just above the $203 resistance level, which may explain why analysts are neutral despite raising targets — they're not convinced the stock will break through.
What would change this
A close above $203 would invalidate the resistance read and suggest the rally has room to run toward the $205 analyst targets and beyond. Conversely, a sustained break below $133.67 — the recent daily low from late September — would signal that the uptrend is losing steam and could trigger a retest of the $126.79 swing low. That level would be the first real support to watch if momentum falters.
Key takeaways
- PTC has rallied 56% in recent weeks and is now 4.9% below resistance at $203.
- Both weekly and daily charts show aligned upward momentum with no conflicting signals.
- Three major banks raised price targets to $205 while staying neutral, suggesting limited conviction above current levels.
- A break above $203 would be the next catalyst; a close below $133.67 would signal weakness.
This one was our pick. The next one is yours.
You've just read the public write-up for PTC. A free account adds the full Pulse Report — the one that normally costs credits — on a symbol you choose, saved to your account and emailed to you.
- One full Pulse Report a week, on any symbol from the published list
- A five-symbol watchlist with live prices and signals
- Earnings dates, analyst targets, news and basic financials for what you follow
- Multi-timeframe charts with the indicators you choose
- Email alerts when something you're watching moves
- Deeper reports in three tiers when you want them — Pulse, Insight and Alpha
No card needed.
Research and education only — not financial advice, and not a recommendation to buy, sell or hold any security. Analysis is generated with AI assistance from measured price data and may contain errors. Prices shown were accurate at the last update. Full terms · How we produce this