Oracle Corporation (ORCL)
Oracle closed at $144.54 on the latest session, and it is sitting in an awkward spot. Over the longer picture the stock has fallen hard, while over the last few weeks it has been trying to bounce. Whether that bounce holds is the question this page is about.
The long-term picture
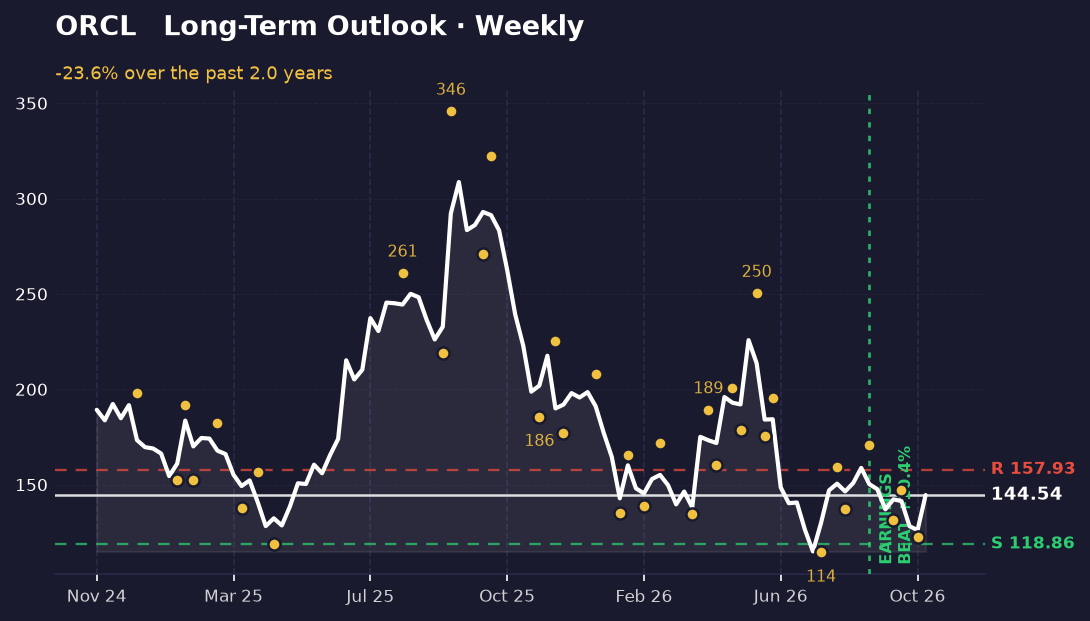
Looking at the weekly chart, which shows roughly the past several months, Oracle has come down from a closing high of $308.66 to its current $144.54. That is a drop of about 53% from the peak. Over the period shown the stock is down 23.6% from where it started, so the broader trend has clearly been lower.
The key swing points on this chart are the intraday high of $170.70 set on September 11 and the low of $122.76 set on October 23. Price has since climbed back toward the middle of that range, and it currently sits about 9% below the nearest resistance at $157.93 and about 18% above support at $118.86. A swing high is a peak where price turned down; a swing low is a dip where it turned back up. The lower highs and lower lows that form a downtrend are what keep the weekly picture bearish.
In plain terms, the long-term structure still leans down. Price has not yet broken back above the recent peaks that would signal a real change in direction.
The short-term picture
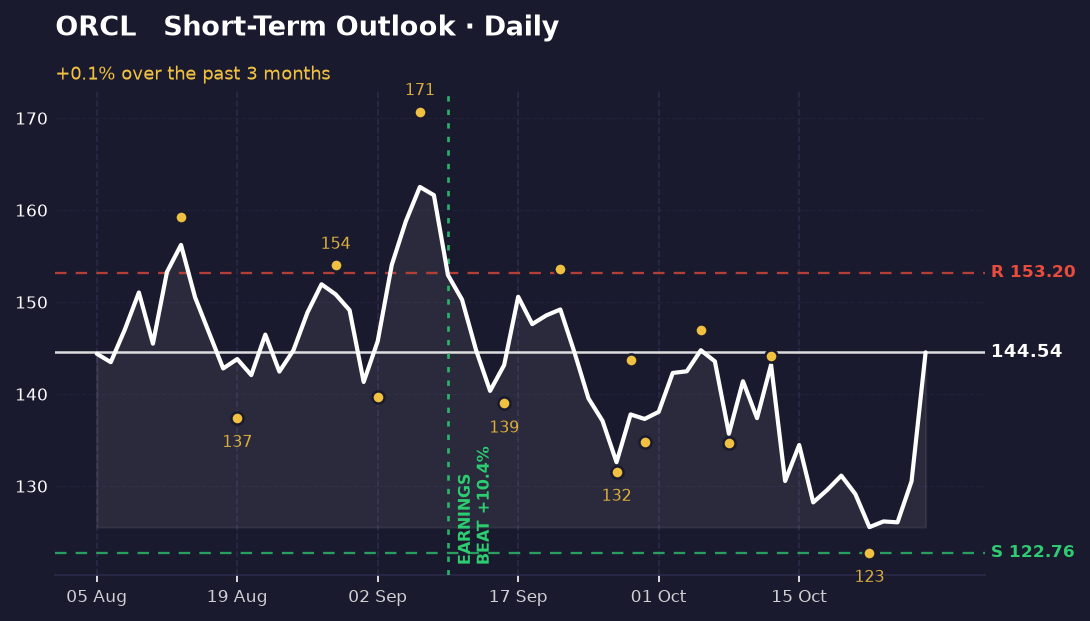
The daily chart, covering the past few months of trading, tells a different story. Over this window Oracle is essentially flat, up 0.1%, and it is sitting roughly in the middle of its recent price range. The momentum reading is neutral, meaning neither buyers nor sellers have clear control at the moment.
The nearest levels to watch are support at $122.76 and resistance at $153.20. Price is about 6% below resistance and about 15% above support. A recent swing high of $146.94 on October 6 and a more recent high of $144.18 on October 13 have both been turned back, and the most recent low of $122.76 on October 22 matches the weekly support line.
The two timeframes disagree. The weekly view is pointing down while the daily view is sideways after a bounce. That conflict matters: a short-term rally inside a longer downtrend is a common pattern, and it does not by itself mean the trend has turned.
What's driving it
Oracle reported earnings on September 10, 2026, and beat expectations by about 10.45%. That result is marked on both charts with a labelled vertical line. The price reaction after that report is part of why the weekly chart looks the way it does.
Recent headlines have focused on Oracle's AI-related cloud products and infrastructure partnerships, a 2030 revenue target above $225 billion announced around an investor day, and broader investor interest in free cash flow and AI spending across large tech companies. These are the stories in the news right now. None of them is a specific price-moving event that the charts above can confirm on their own.
What would change this
The weekly read turns more constructive if Oracle closes back above the $157.93 resistance level and holds it. That would break the sequence of lower highs and suggest the longer downtrend is losing steam. Failing that, a move back below the $118.86 support would confirm the weekly downtrend and open the door to new lows.
On the daily chart, a close above $153.20 would show buyers taking control of the short-term picture. A drop below $122.76 would undo the recent bounce and line the daily chart up with the weekly downtrend, which would mean the two timeframes agree again, but to the downside.
Key takeaways
- Oracle closed at $144.54, down about 53% from its closing high of $308.66 set earlier in the period shown.
- The weekly trend is still down, with lower highs and lower lows since the September peak.
- The daily chart is flat and sits between support at $122.76 and resistance at $153.20.
- The weekly and daily views disagree, so a short-term bounce should not be read as a trend change until resistance at $157.93 is cleared.
This one was our pick. The next one is yours.
You've just read the public write-up for ORCL. A free account adds the full Pulse Report — the one that normally costs credits — on a symbol you choose, saved to your account and emailed to you.
- One full Pulse Report a week, on any symbol from the published list
- A five-symbol watchlist with live prices and signals
- Earnings dates, analyst targets, news and basic financials for what you follow
- Multi-timeframe charts with the indicators you choose
- Email alerts when something you're watching moves
- Deeper reports in three tiers when you want them — Pulse, Insight and Alpha
No card needed.
Research and education only — not financial advice, and not a recommendation to buy, sell or hold any security. Analysis is generated with AI assistance from measured price data and may contain errors. Prices shown were accurate at the last update. Full terms · How we produce this