ON Semiconductor Corporation (ON)
ON Semiconductor closed at 73.23, down 12.6% over the past few weeks but still holding above a key support level. The weekly and daily charts are telling different stories right now—one bullish, one cautious—which makes this a moment worth understanding.
The long-term picture
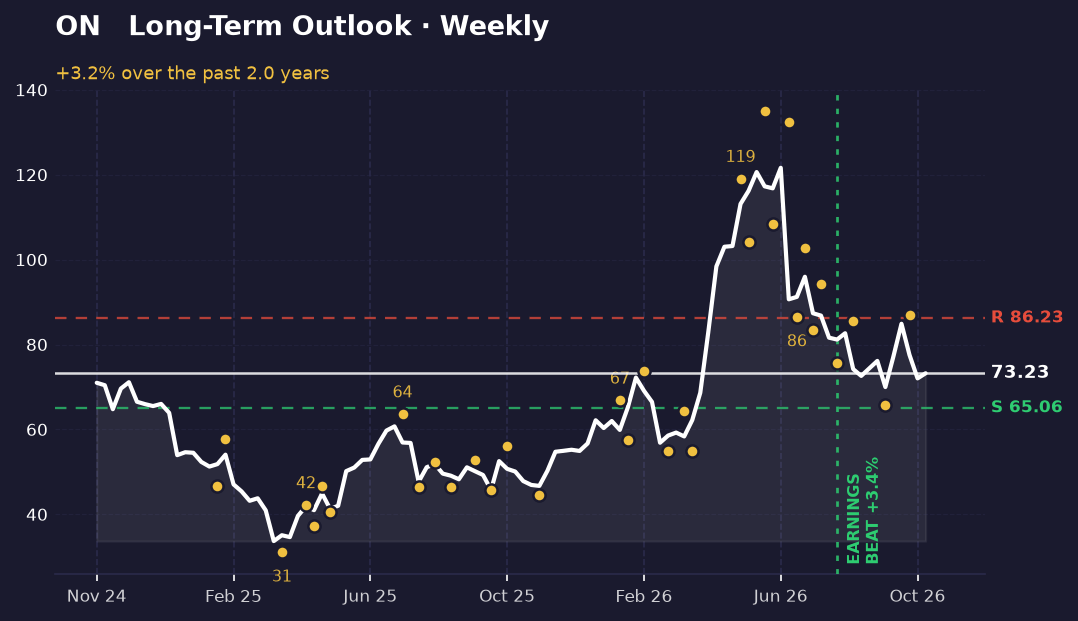
On the weekly chart, ON is in a clear uptrend. The stock bounced off a low of 65.80 in mid-September, then rallied to 86.92 in early October. That October high marks the recent swing top. Today's close at 73.23 sits 11.2% above the weekly support level of 65.06, and 17.8% below the resistance at 86.23. The stock is roughly in the middle of its recent range, having recovered from its lows but not yet retesting the highs.
The bigger picture is important: ON is still 39.8% below its 52-week high of 121.62, so this uptrend is a recovery within a much larger decline. The weekly structure suggests the stock is finding its footing, but it hasn't yet proven it can sustain a push back toward the October highs.
The short-term picture
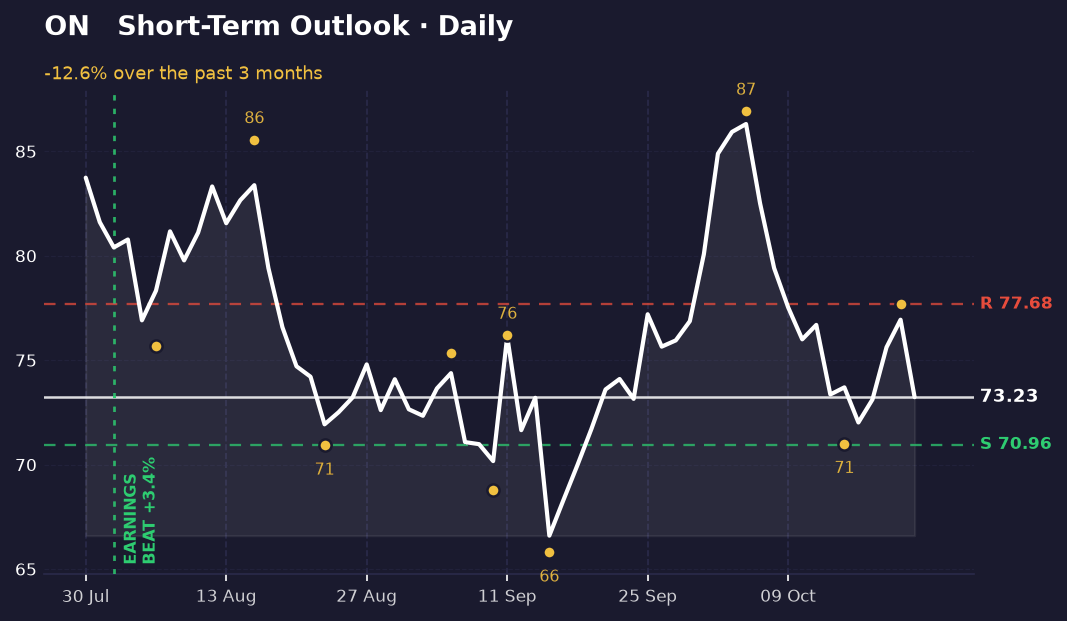
The daily chart shows a sharper, more urgent picture. ON has fallen 12.6% from its recent entry point of 83.74, and it's now sitting just 3.1% above the daily support at 70.96. The most recent daily high was 77.69 on October 21, and the stock is 6.1% below that level. This is a pullback with teeth—price has moved into the lower third of its recent daily range.
Here's where the conflict matters: the weekly chart suggests ON is in an uptrend and holding support, but the daily chart shows momentum has reversed sharply. The stock is testing whether it can hold the 70.96 support level. If it does, the weekly view remains intact. If it breaks below, the daily weakness becomes a warning that the weekly recovery may be stalling.
What's driving it
ON beat earnings on August 3 by 3.42%, a modest surprise that marked a turning point on both charts. Since then, analyst activity has been mixed. B. Riley Securities maintains a Buy rating but lowered its price target to 105, and Susquehanna adjusted both its price target and rating. The recent headlines focus on Vadzo Imaging's camera launches for safety and pathology applications—products that may use ON's semiconductor components, but these are not direct ON announcements and their impact on the company's near-term results is unclear.
What would change this
The daily support at 70.96 is the critical line. If ON closes below it, the daily weakness breaks free from the weekly uptrend, and the picture shifts from a pullback within a recovery to a potential breakdown. That would suggest the October high of 86.92 was a local top, not a stepping stone higher.
On the upside, a close above the daily resistance at 77.68 would begin to rebuild momentum and align the daily chart with the weekly uptrend. A move back above 86.23 (the weekly resistance) would confirm that the recovery is intact and the stock is ready to test the October highs again.
Key takeaways
- ON is 40% below its 52-week high, but the weekly chart shows an uptrend since mid-September.
- The daily chart conflicts with the weekly view: a sharp 12.6% pullback has price just 3.1% above daily support at 70.96.
- Earnings beat in August marked the start of the recovery, but recent analyst downgrades suggest caution.
- The next move below 70.96 or above 77.68 will clarify whether the weekly uptrend holds or the daily weakness takes over.
This one was our pick. The next one is yours.
You've just read the public write-up for ON. A free account adds the full Pulse Report — the one that normally costs credits — on a symbol you choose, saved to your account and emailed to you.
- One full Pulse Report a week, on any symbol from the published list
- A five-symbol watchlist with live prices and signals
- Earnings dates, analyst targets, news and basic financials for what you follow
- Multi-timeframe charts with the indicators you choose
- Email alerts when something you're watching moves
- Deeper reports in three tiers when you want them — Pulse, Insight and Alpha
No card needed.
Research and education only — not financial advice, and not a recommendation to buy, sell or hold any security. Analysis is generated with AI assistance from measured price data and may contain errors. Prices shown were accurate at the last update. Full terms · How we produce this