Okta, Inc. (OKTA)
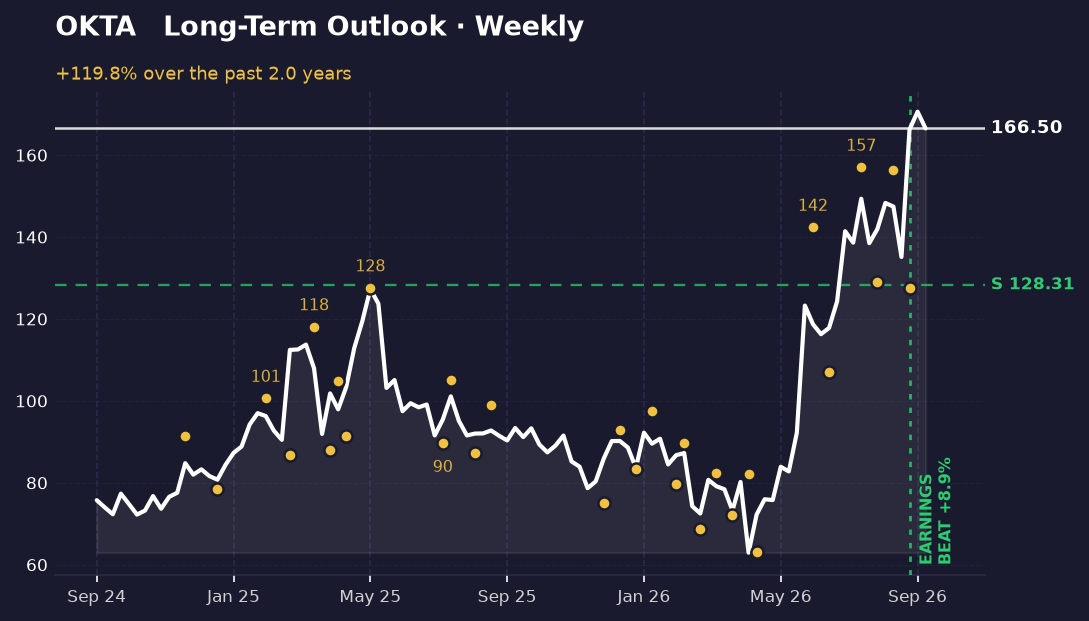
Okta closed at 166.50 on strong earnings momentum, sitting just 2.4% below its all-time high of 170.60. The stock has nearly doubled from its starting point over this period, and recent headlines confirm it's hitting 52-week highs as cybersecurity stocks rally. The question now is whether this momentum holds or pulls back to test support.
The long-term picture
Over the past several months, Okta has traced a clear uptrend punctuated by two distinct pullbacks. The stock swung down to 129.02 in late July, then recovered to 156.39 by mid-August before dipping again to 127.60 at the end of August. Each time it's found support near 128.31—a level that's held twice now. The current close at 166.50 sits 22.9% above that support, suggesting the stock has room to move before testing it again.
The weekly picture shows Okta positioned at the extreme top of its range. At 96.2% of the way from its lowest close to its highest, there's little room left before hitting resistance at the all-time high. The recent earnings beat on August 26 appears to have provided the fuel for this latest leg higher, and the stock is now trading in territory where reversals become more likely simply because there's less upside left to chase.
The short-term picture
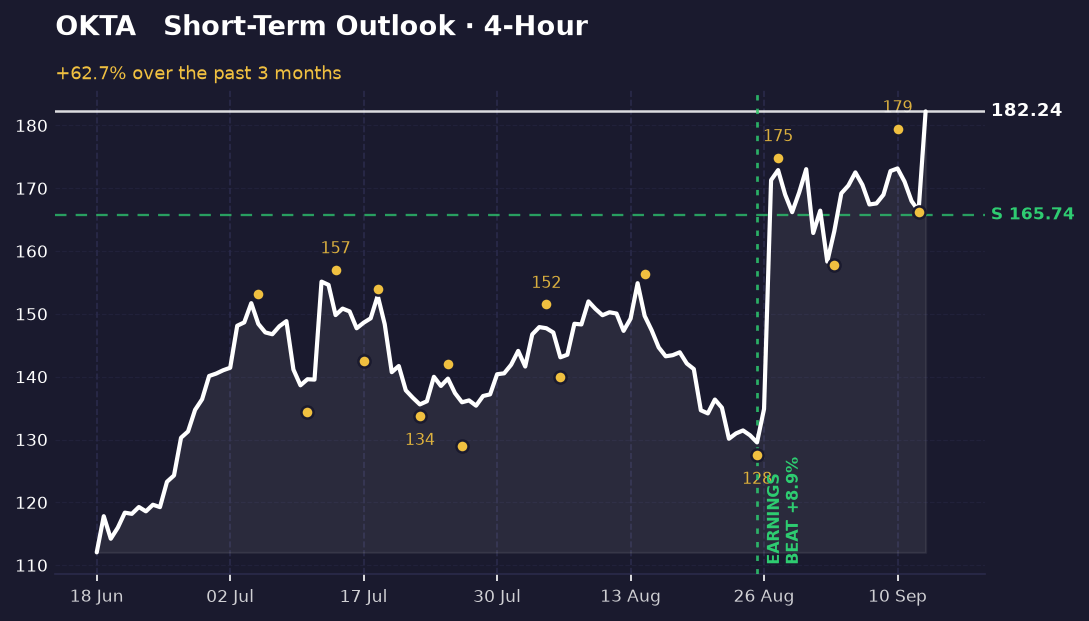
Four-hour chart data is not available for this analysis, so we cannot assess the immediate momentum or intraday support and resistance levels. This is a meaningful gap—without the shorter timeframe, we're reading only the weekly structure and cannot confirm whether the current price is consolidating near the highs or showing signs of weakness that might precede a pullback to 128.31.
What's driving it
Okta beat earnings on August 26 by 8.93%, a meaningful surprise that appears to have triggered the move toward 52-week highs. The broader cybersecurity sector is also rallying as AI safety concerns heat up in the market, providing tailwind for the stock. Nasdaq weakness and rising yields (the 10-year touched 5%) are headwinds for growth stocks generally, but Okta's earnings beat and sector momentum have so far overcome that pressure.
What would change this
A close below 128.31 would break the support level that's held twice in the past two months and would signal a shift from the current uptrend. That would likely trigger a deeper pullback toward the 127.60 low or lower. Conversely, a break above 170.60 would confirm new all-time highs and suggest the uptrend has more room to run—though the stock is already so close to that level that it's a near-term test rather than a distant target. Watch for how the stock behaves if it touches 170.60; rejection there would be a warning sign even if support holds.
Key takeaways
- Okta closed at 166.50, just 2.4% below its all-time high of 170.60 after beating earnings by 8.93% on August 26.
- Support at 128.31 has held twice in the past two months, sitting 22.9% below the current price.
- The stock is positioned at the extreme top of its multi-month range with little room left before hitting resistance at the all-time high.
- Four-hour chart data is unavailable, limiting visibility into immediate momentum and intraday support levels.
This one was our pick. The next one is yours.
You've just read the public write-up for OKTA. A free account adds the full Pulse Report — the one that normally costs credits — on a symbol you choose, saved to your account and emailed to you.
- One full Pulse Report a week, on any symbol from the published list
- A five-symbol watchlist with live prices and signals
- Earnings dates, analyst targets, news and basic financials for what you follow
- Multi-timeframe charts with the indicators you choose
- Email alerts when something you're watching moves
- Deeper reports in three tiers when you want them — Pulse, Insight and Alpha
No card needed.
Research and education only — not financial advice, and not a recommendation to buy, sell or hold any security. Analysis is generated with AI assistance from measured price data and may contain errors. Prices shown were accurate at the last update. Full terms · How we produce this