NVIDIA Corporation (NVDA)
Nvidia closed at $213.66, sitting well above where it was a few months ago but a little off its recent high. The longer chart still points up, while the shorter chart has turned down over the past few sessions. That split is the main thing worth understanding here.
The long-term picture
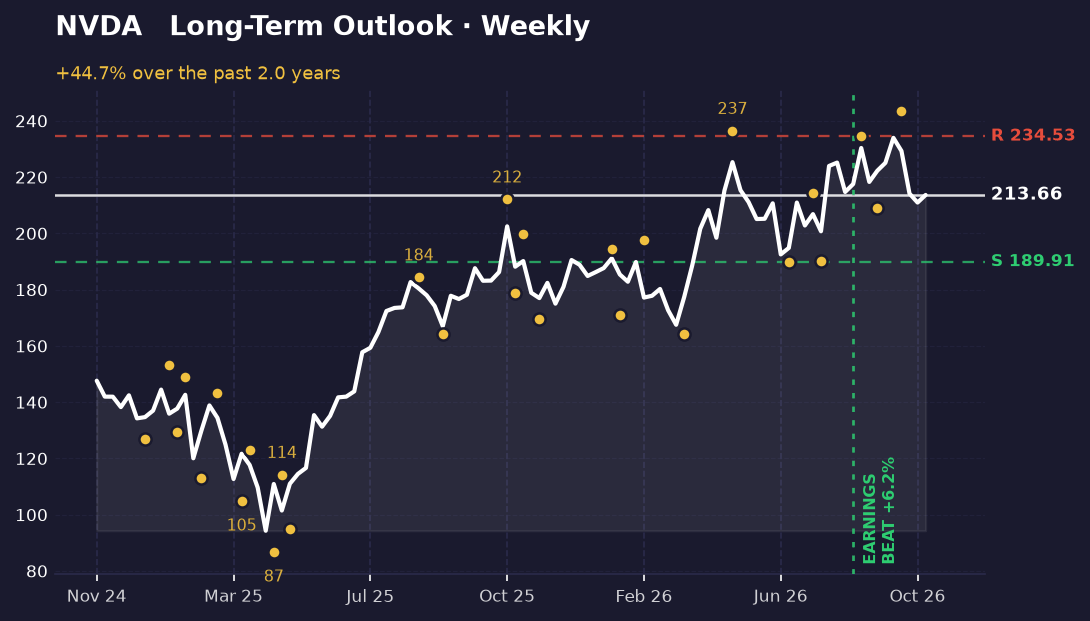
Looking at the weekly chart, which shows roughly the last six months of trading, Nvidia has climbed from a low of about $94 to a high near $234 on a closing basis. The stock is trading near the upper part of that range, which is where it has been spending its time lately.
The bigger structure is a series of higher lows and higher highs. The most recent swing low came in at $208.93 in mid-September, and the swing high before that was $243.37 in early October. Those rising peaks and troughs are what give the trend its shape. Support, the price area where buyers have stepped in before, sits near $189.91. Resistance, where sellers have pushed back, is near $234.53. The stock is about 11% above support and about 10% below resistance, so it has room in both directions.
The short-term picture
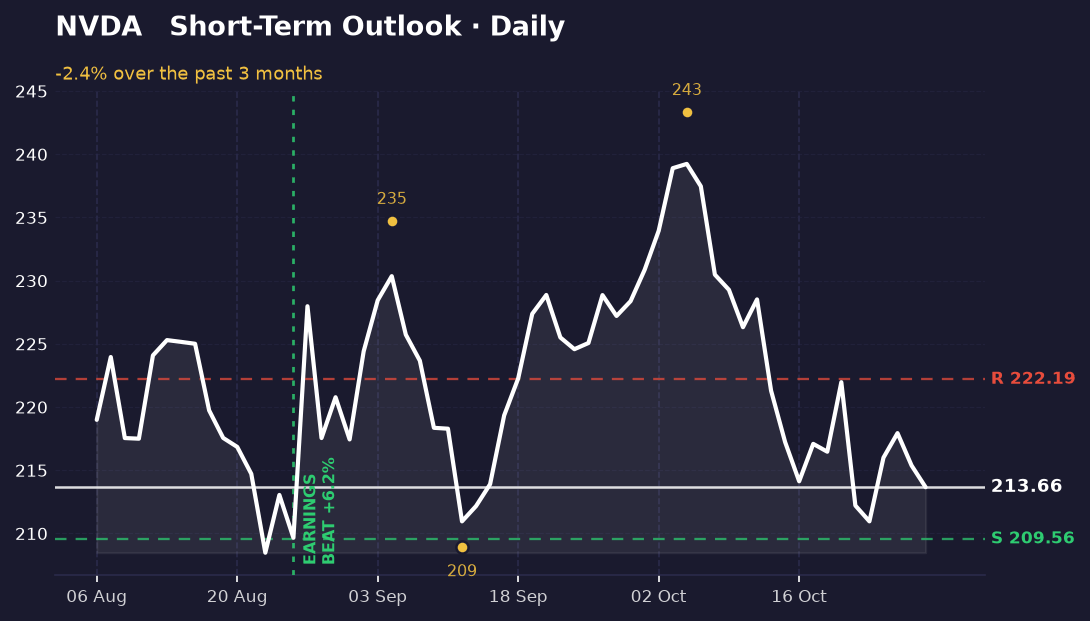
The daily chart tells a different story. Over the most recent stretch, Nvidia has pulled back, and momentum has weakened. The recent high was $243.37, and the stock is now roughly 11% below the top of that move on a closing basis. Price sits near the lower part of its recent range, not the upper part.
The nearest support on this chart is around $209.56, and resistance is near $222.19. The stock is only about 2% above that support, which means it's close to the bottom of the short-term range. A move down through that level would be the first clear sign that the pullback is picking up steam.
The two timeframes disagree. The weekly view still leans up, and the daily view leans down. That doesn't make either one wrong. It means the bigger trend and the recent move are pulling in opposite directions for now.
What's driving it
The most recent earnings report, released August 26, 2026, beat expectations by about 6%. That's marked on both charts. Earnings beats don't guarantee price gains, but this one sits behind the longer uptrend.
The news flow since then has been mixed. Headlines include reports of Nvidia moving to back a cloud provider's $45 billion project tied to Anthropic, a DOJ probe, and a Chinese spy report that weighed on shares after hours. Senator Elizabeth Warren has also called on Nvidia's board and CEO Jensen Huang to answer questions about reported ties. These are the kinds of stories that can pressure a stock in the short run, and they may help explain the recent weakness on the daily chart, though the price data alone doesn't confirm that link.
What would change this
The weekly picture stays intact as long as Nvidia holds above the $190 support area. A weekly close below that level would break the rising structure and would change the long-term read from up to uncertain.
On the daily chart, the key line is about $209.56. A close below it would confirm that the short-term pullback is deepening and would put the stock at the bottom of its recent range. Reclaiming $222.19 would be the first sign that buyers are pushing back, and a move above it would start to narrow the gap between the two timeframes.
Key takeaways
- Nvidia is up 44.7% over the period covered by the weekly chart, but about 9% below its highest close.
- The weekly trend still points up, with support near $190 and resistance near $235.
- The daily chart has turned down, and the stock is only about 2% above its nearest short-term support at $209.56.
- The two timeframes conflict, so the next break of $209.56 or $222.19 will be the clearest signal on which view wins.
This one was our pick. The next one is yours.
You've just read the public write-up for NVDA. A free account adds the full Pulse Report — the one that normally costs credits — on a symbol you choose, saved to your account and emailed to you.
- One full Pulse Report a week, on any symbol from the published list
- A five-symbol watchlist with live prices and signals
- Earnings dates, analyst targets, news and basic financials for what you follow
- Multi-timeframe charts with the indicators you choose
- Email alerts when something you're watching moves
- Deeper reports in three tiers when you want them — Pulse, Insight and Alpha
No card needed.
Research and education only — not financial advice, and not a recommendation to buy, sell or hold any security. Analysis is generated with AI assistance from measured price data and may contain errors. Prices shown were accurate at the last update. Full terms · How we produce this