ServiceNow, Inc. (NOW)
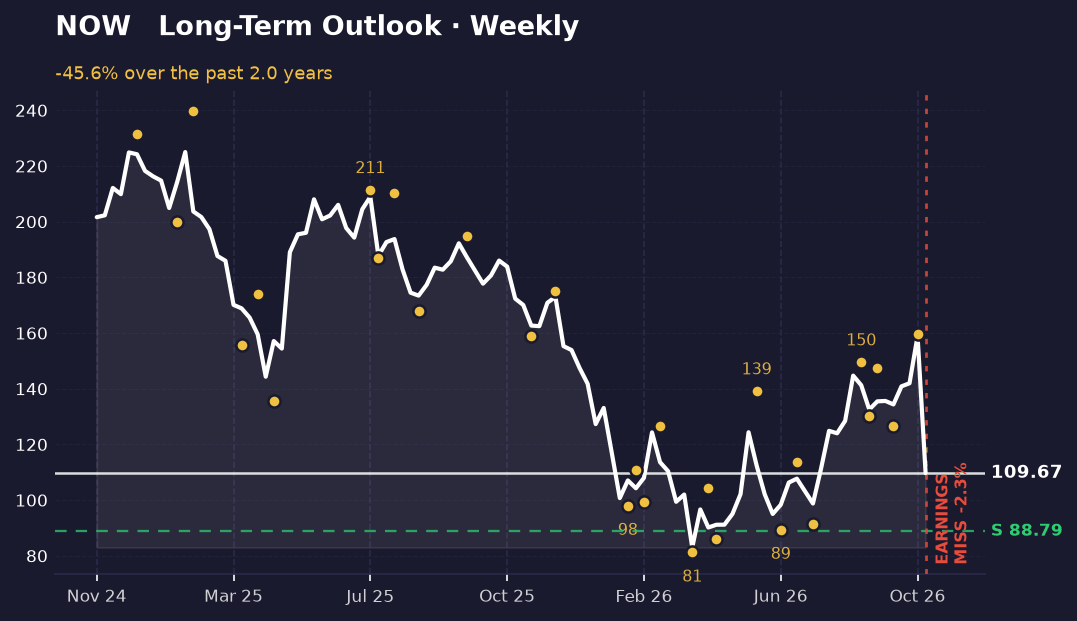
ServiceNow has had a rough stretch. Over the period on the weekly chart, the stock closed down about 46%, from roughly $202 to $110. Both the longer and shorter views are moving in the same direction right now, which makes the current downtrend harder to dismiss as noise.
The long-term picture
The weekly chart covers the multi-month picture. The stock peaked at a closing high of $225 and bottomed at a closing low of $83, so it has traded through a wide range. Today's close of $109.67 sits near the lower part of that range, about 19% of the way up from the bottom.
The swing points tell a more specific story. Intraday highs and lows since September show a sequence of lower-to-higher steps: a low near $130 in mid-September, a high near $148, a low near $127 in early October, then a high near $160 in late October. Those higher lows and higher highs describe a bounce that did real work, but price has since fallen back below that recent zone.
The nearest support the chart identifies sits at about $88.79, roughly 19% below the current price. No resistance level is marked above.
The short-term picture
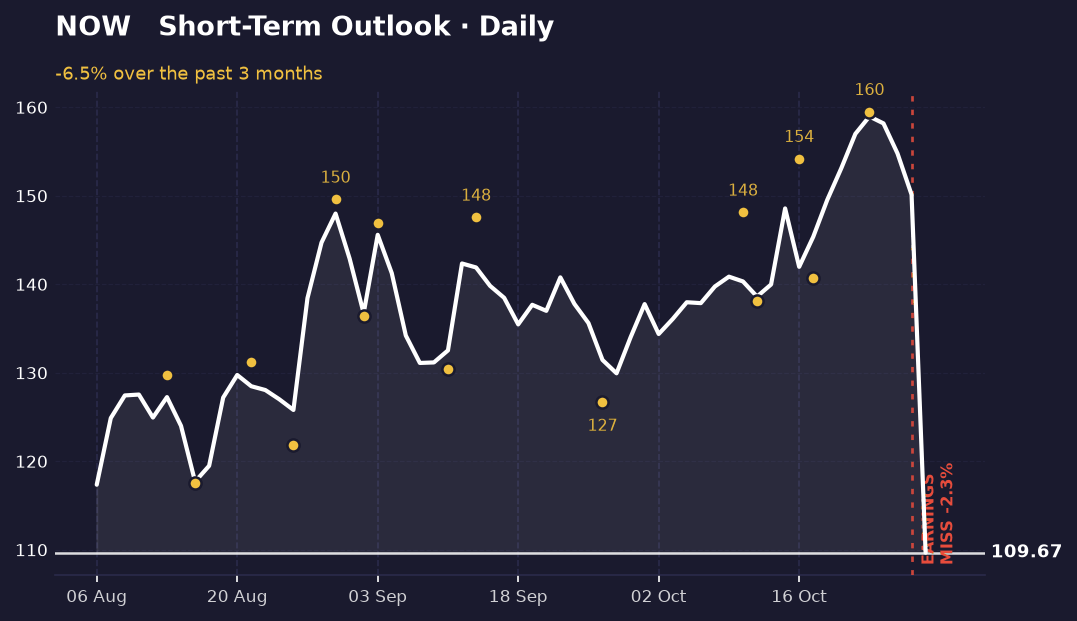
The daily chart shows the recent move in more detail. The stock opened the period near $117 and has dropped about 6.5% since, with a closing high near $159 in late October. Today's close is the lowest close in that daily window, meaning price has pushed to new short-term lows.
Momentum on this timeframe points down, and it agrees with the weekly view. The two timeframes are aligned, so there is no conflict to weigh here. Both the longer and shorter charts are telling the same story.
The daily chart marks no clear support or resistance level, so the nearest reference points are the recent swing lows around $138 and $141 from mid-to-late October, both well above the current price.
What's driving it
The most recent earnings report, dated October 28, came in slightly below expectations, a miss of about 2.3%. That line is marked on both charts. The stock's behaviour around that date is part of why the recent swings look the way they do.
The headlines in the past few weeks are mostly analyst notes. Macquarie kept a Neutral rating and raised its price target to $120. RBC kept an Outperform rating but lowered its target to $165. JP Morgan kept an Overweight rating and raised its target to $160. A law firm also announced an investigation into the company. None of these is a price-moving event on its own, but together they show that analysts are still broadly constructive while trimming or adjusting expectations.
What would change this
The current read is downward. It would weaken if price closes back above the late-October high near $160 and holds there. A move like that would break the lower-high pattern on the daily chart and suggest the trend has turned.
On the downside, a daily close below the recent low near $110 would confirm that the stock is still making new lows. A drop toward the marked support near $89 would be the next major test, and it would mark a deeper break in the weekly structure.
Key takeaways
- ServiceNow closed about 46% lower over the weekly chart's period, from roughly $202 to $110.
- Both the weekly and daily charts are trending down, so the two timeframes agree.
- The nearest marked support is near $89, about 19% below today's close, and no resistance is marked above.
- A close back above roughly $160 would be the first real sign that the downtrend is breaking.
This one was our pick. The next one is yours.
You've just read the public write-up for NOW. A free account adds the full Pulse Report — the one that normally costs credits — on a symbol you choose, saved to your account and emailed to you.
- One full Pulse Report a week, on any symbol from the published list
- A five-symbol watchlist with live prices and signals
- Earnings dates, analyst targets, news and basic financials for what you follow
- Multi-timeframe charts with the indicators you choose
- Email alerts when something you're watching moves
- Deeper reports in three tiers when you want them — Pulse, Insight and Alpha
No card needed.
Research and education only — not financial advice, and not a recommendation to buy, sell or hold any security. Analysis is generated with AI assistance from measured price data and may contain errors. Prices shown were accurate at the last update. Full terms · How we produce this