Nebius Group N.V. (NBIS)
Nebius Group has more than tripled its price over the past year, closing at 171.99 most recently. The last few weeks have been rougher, though, with the stock down about 9% from where it started the period. That split between a strong long-term trend and a weaker recent stretch is what makes it worth a closer look.
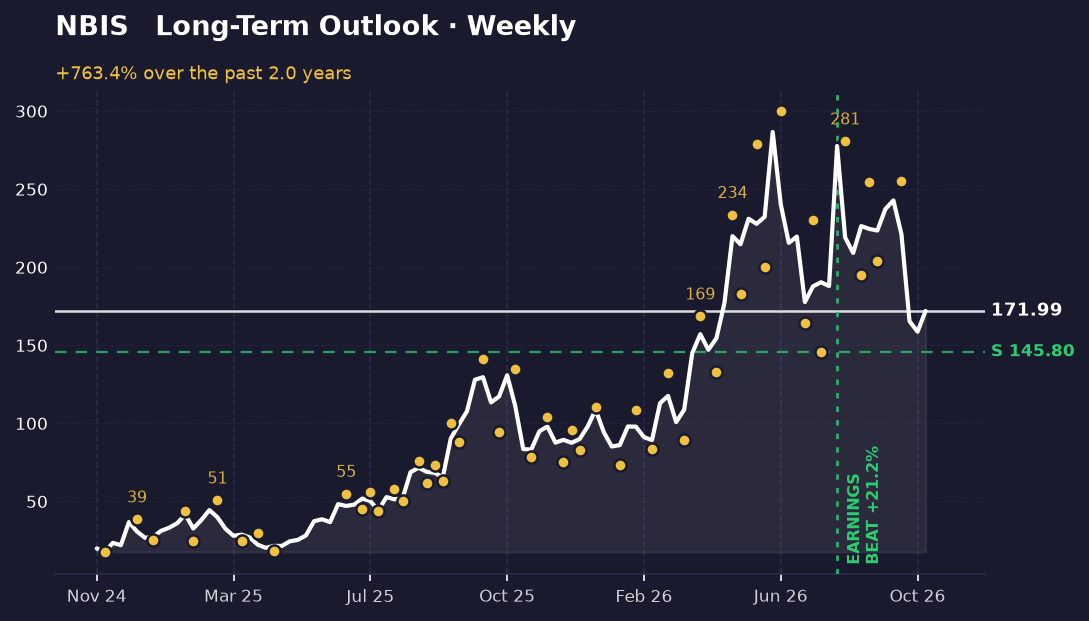
The long-term picture
On the weekly chart, the bigger picture is still upward. Price has climbed from a closing low of 17.6 to the current 171.99, a rise of roughly 760%. It peaked on a closing basis at 286.69, so the stock is about 40% below that high, but well above where the rally began.
The weekly swings tell a more recent story. Intraday, the stock bottomed near 194.8 in early September, bounced to 254.74 a week later, pulled back to 203.87 in mid-September, and then reached 255.1 in early October. Those higher lows and a high near 255 show a market that has been building a base in the 195 to 255 area.
The nearest support on this chart sits at 145.8, about 15% below the current price. There is no clear resistance level marked above, so the weekly chart does not show a defined ceiling yet.
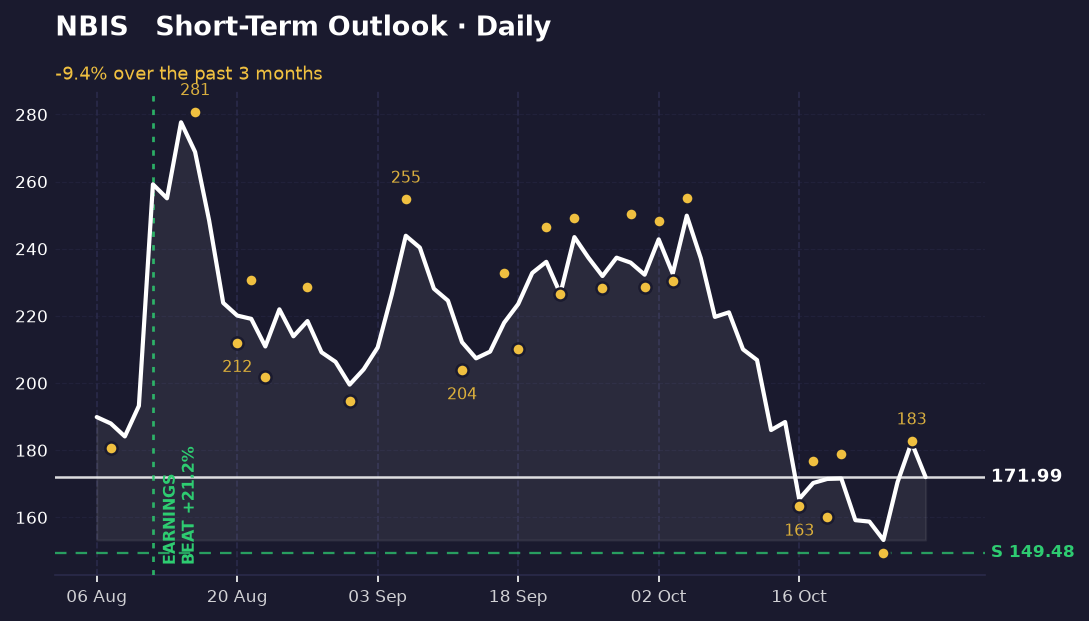
The short-term picture
The daily chart tells a different story. Over the recent period, momentum has been weak. The stock opened near 189.88 and has finished about 9% lower. It sits close to the bottom of its recent closing range, at about the 15% mark, which means it has been trading near its lows rather than its highs.
The short-term swings reflect this. Price dropped to 160.25 on October 20, bounced to 178.85 the next day, fell again to 149.48 on October 26, and then rallied to 182.74 on October 28. That sequence shows buyers stepping in around 150 to 160, but without the momentum to keep pushing higher for long.
The two timeframes disagree. The weekly chart points up and the daily chart points down. Neither view cancels the other, so a reader should keep both in mind rather than picking one.
What's driving it
The most recent earnings report, dated August 12, 2026, was a beat, with results about 21% above expectations. That marks the quarter as a positive one, though the stock's recent weakness has come after it.
The headlines in the data point to two main forces. One is a broader sector sell-off: a report describes Google and Microsoft's AI spending worries weighing on neocloud stocks, including Nebius, which gave up their best week in more than two months. The other is company news, with a report that Nebius secured funding for a data center in France. Nothing in the supplied headlines points to a specific new catalyst for the coming weeks.
What would change this
The weekly read would weaken if price closes below the 145.8 support level. That would break the pattern of higher lows and put the stock in the area it last held around the start of the year's rally, so it would signal the long-term uptrend is no longer intact.
The daily read would turn more positive if price climbs back above the recent high near 182.74 and holds there. Doing so would end the run of lower highs on the short-term chart and suggest the pullback is over. A close below the recent low of 149.48 would confirm the weakness is deepening.
Key takeaways
- NBIS has risen about 760% on the weekly closing range since its low of 17.6, but is roughly 40% below its closing high of 286.69.
- The weekly chart's higher lows, around 195 and 204, show the stock has been building a base above 195.
- The daily chart is weak, with the stock finishing about 9% lower and trading near the bottom of its recent range.
- Support sits at 145.8 on the weekly chart and 149.48 on the daily chart; a close below either would change the read.
This one was our pick. The next one is yours.
You've just read the public write-up for NBIS. A free account adds the full Pulse Report — the one that normally costs credits — on a symbol you choose, saved to your account and emailed to you.
- One full Pulse Report a week, on any symbol from the published list
- A five-symbol watchlist with live prices and signals
- Earnings dates, analyst targets, news and basic financials for what you follow
- Multi-timeframe charts with the indicators you choose
- Email alerts when something you're watching moves
- Deeper reports in three tiers when you want them — Pulse, Insight and Alpha
No card needed.
Research and education only — not financial advice, and not a recommendation to buy, sell or hold any security. Analysis is generated with AI assistance from measured price data and may contain errors. Prices shown were accurate at the last update. Full terms · How we produce this