Micron Technology, Inc. (MU)
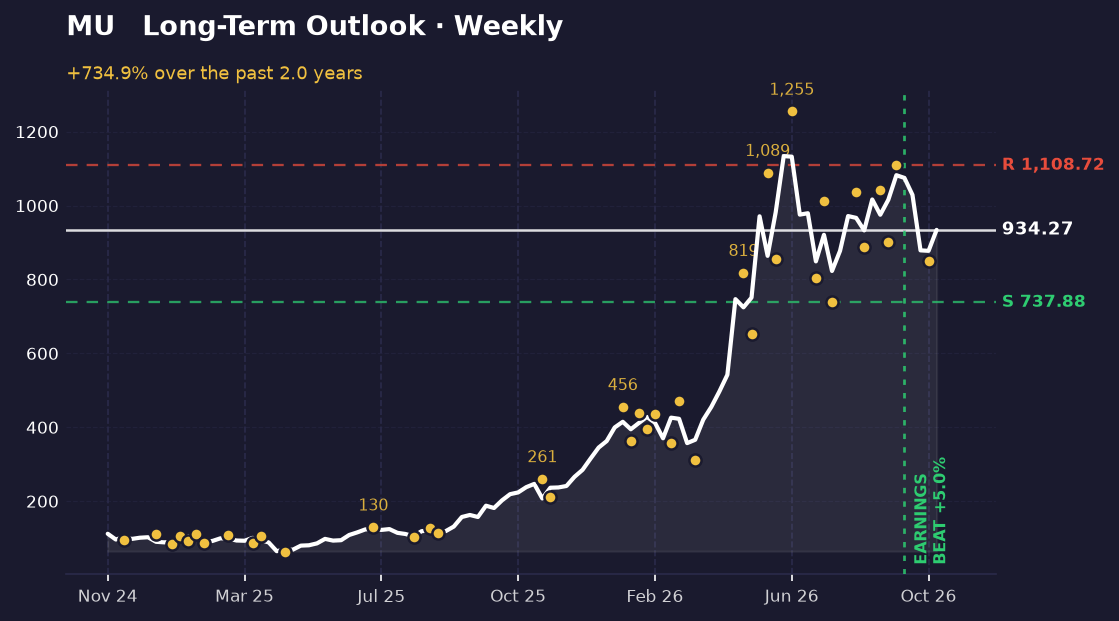
Micron Technology has had a remarkable run. Its weekly closing price has climbed roughly 735% over the period in view, and it closed at $934.27 on the latest bar. The more interesting question is what has happened since the peak: the stock is about 18% below its highest weekly close and has been moving sideways-to-up on the daily chart over the past few weeks.
The long-term picture
On the weekly chart, the big picture is a strong uptrend. The stock went from a low close near $64.72 to a high close near $1,133.99, and it now sits in the upper part of its closing range, about 81% of the way from the bottom to the top. That's a healthy position on its own.
The swing points tell a more nuanced story. Recent intraday peaks came in at $1,042.40 in mid-September and $1,108.72 in late September. Between them, the stock dipped to $902.60, and later to $849.25 in late October. Those are the price zones where buyers and sellers have been fighting. Lower highs and higher lows are the signature of a trend; here, the most recent low sits well below the last peak, which means the stock has retraced meaningfully without yet breaking the broader pattern.
The weekly support level is $737.88, about 21% below the current price. The weekly resistance level is $1,108.72, about 19% above it. Price is sitting roughly in the middle of that band, closer to resistance than to support.
The short-term picture
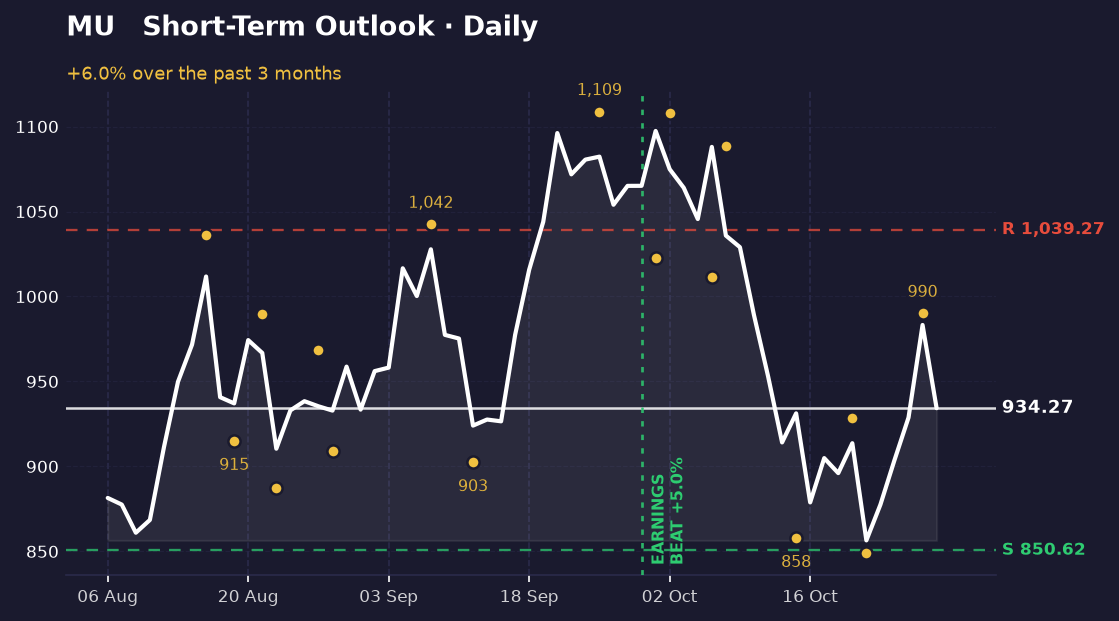
The daily chart shows a more mixed picture. Over the recent window, the stock is up about 6%, from $881.47 to $934.27. Momentum has improved from its lows, but the stock is still roughly 15% below its highest daily close of $1,097.39.
The daily swings are: a low at $858.00 in mid-October, a high at $928.45 on October 21, a low at $849.25 on October 22, and a high at $990.00 on October 28. That sequence is a pattern of higher highs and higher lows over the last few weeks, which points to a short-term rebound. Support is at $850.62 and resistance at $1,039.27.
The weekly and daily views are pointing the same direction right now, both upward. That alignment is the reason the short-term read looks constructive, though the stock still has meaningful distance to cover before it retests its recent highs.
What's driving it
The most recent earnings report, dated September 30, beat expectations by about 5%. The chart marks that date with a vertical line, and the stock's behaviour around it is part of the story the weekly chart is telling.
Headlines in the recent window are mixed. One reports Micron stock falling after a Samsung earnings report, which points to read-across from a competitor. Another describes a broader tech and semiconductor sell-off in which Alphabet dropped 12%. Those stories suggest sector-wide pressure has been a factor alongside company-specific results.
What would change this
The constructive read on the daily chart depends on the stock holding above its recent low around $849. If it breaks below that level, the sequence of higher lows would be broken and the short-term picture would turn negative, with the next support zone near $738 on the weekly chart.
On the upside, a daily close above the $1,039 resistance would mean the recent rebound has the strength to challenge the late-September high near $1,109. A weekly close above that high would confirm a renewed push higher and would weaken the case that the stock is consolidating.
Key takeaways
- Micron is up about 735% on the weekly chart from its lowest close, but about 18% below its highest weekly close.
- The daily chart shows higher highs and higher lows over the recent weeks, with support near $851 and resistance near $1,039.
- The weekly and daily views agree on direction right now, both pointing up.
- A break below roughly $849 would undermine the short-term rebound; a close above $1,109 would challenge the recent high.
This one was our pick. The next one is yours.
You've just read the public write-up for MU. A free account adds the full Pulse Report — the one that normally costs credits — on a symbol you choose, saved to your account and emailed to you.
- One full Pulse Report a week, on any symbol from the published list
- A five-symbol watchlist with live prices and signals
- Earnings dates, analyst targets, news and basic financials for what you follow
- Multi-timeframe charts with the indicators you choose
- Email alerts when something you're watching moves
- Deeper reports in three tiers when you want them — Pulse, Insight and Alpha
No card needed.
Research and education only — not financial advice, and not a recommendation to buy, sell or hold any security. Analysis is generated with AI assistance from measured price data and may contain errors. Prices shown were accurate at the last update. Full terms · How we produce this