Microsoft Corporation (MSFT)
Microsoft has climbed about 23.5% over the past several months and is sitting close to the top of its recent range. Both the longer and shorter views are pointing the same way, which is why it is worth a closer look. Below is what the charts show and the levels that matter.
The long-term picture
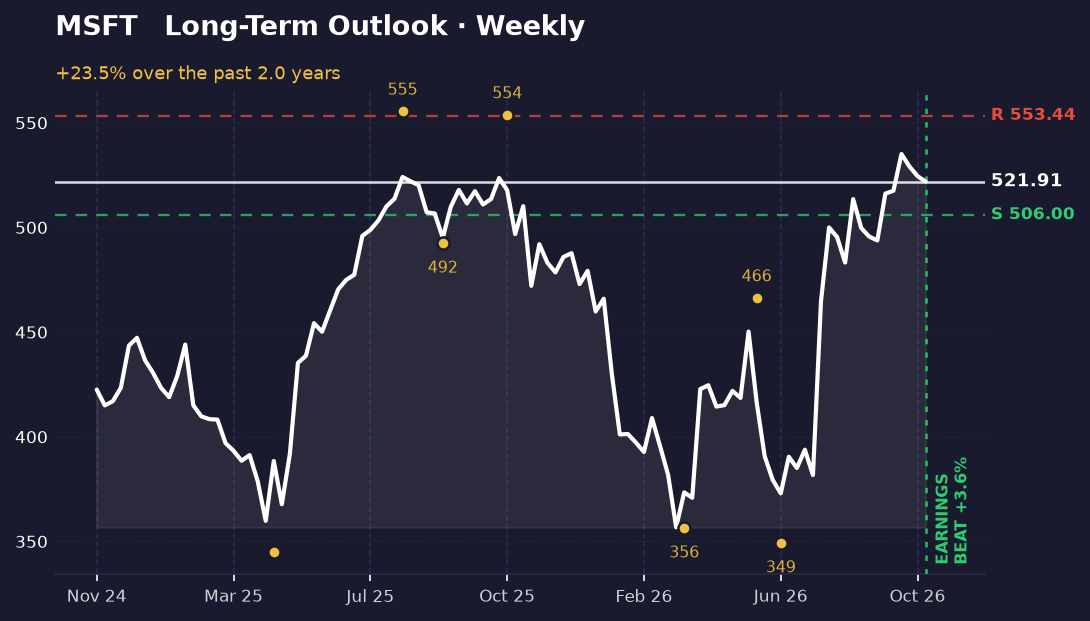
Looking at the weekly chart, the trend over the past several months has been clearly up. The stock moved from a low of about 357 to a high near 535 on closing prices, and it currently sits near the top of that span, at 521.91.
The swing points tell the story of the trend. Intraday highs came in around 554 in late October 2025 and again near 466 in June 2026, while the lows near 356 in April 2026 and 349 in late June 2026 mark where buyers stepped in. The most recent low was therefore clearly above the earlier one, which is the pattern of an uptrend.
Price is currently about 3% above a support level near 506 and about 6% below resistance near 553. In plain terms, the stock is in the upper part of its structure, with room to move before it runs into the ceiling from the late 2025 high.
The short-term picture
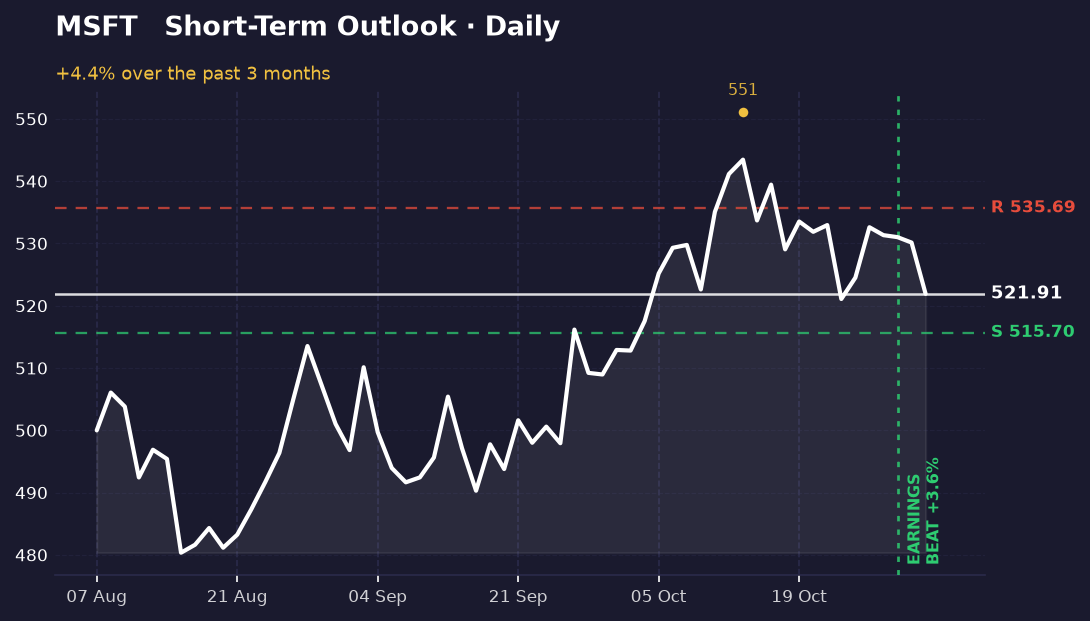
The daily chart shows momentum that has picked up recently. Over the recent stretch, the stock rose about 4.4%, and it has bounced from a low near 480 back up to 522.
This matches the weekly picture, so the two timeframes are aligned. Both are moving in the same direction, which generally makes the read more consistent. The stock is still about 4% below its recent closing high of 543.
The nearest levels are close. Support sits around 516, only about 1.2% below the current price, and resistance near 536 is about 2.6% above. A move through either would be the next thing to watch on this chart.
What's driving it
Microsoft's most recent earnings report, dated October 28, 2026, came in ahead of expectations by about 3.6%, which is the main company-specific event on the chart. The earnings date is marked with a vertical line on both charts.
Recent headlines include a planned $25 billion investment-grade bond sale and a strategic AI partnership with The Estée Lauder Companies. Neither has a clear, direct link to the price move on the chart, so treat them as background rather than the driver.
What would change this
The read here stays intact as long as the stock holds above the support near 506 on the weekly chart. A close below that level would weaken the uptrend and put the most recent low near 349 back in view as a possible destination, which would change the picture from a rising trend to a broader pullback.
On the shorter view, losing the 516 support would mean the recent bounce has failed and the two timeframes would likely stop agreeing. A clean move above the 536 resistance, by contrast, would open the way toward the recent high near 543 and the longer-term ceiling near 553.
Key takeaways
- MSFT closed at 521.91 and sits near the top of its recent range, about 6% below resistance near 553.
- Both the weekly and daily charts are moving upward, so the two timeframes are aligned.
- The most recent low near 349 is well below current levels, while the weekly support near 506 is the level to watch.
- The most recent earnings report, on October 28, 2026, beat expectations by about 3.6%.
This one was our pick. The next one is yours.
You've just read the public write-up for MSFT. A free account adds the full Pulse Report — the one that normally costs credits — on a symbol you choose, saved to your account and emailed to you.
- One full Pulse Report a week, on any symbol from the published list
- A five-symbol watchlist with live prices and signals
- Earnings dates, analyst targets, news and basic financials for what you follow
- Multi-timeframe charts with the indicators you choose
- Email alerts when something you're watching moves
- Deeper reports in three tiers when you want them — Pulse, Insight and Alpha
No card needed.
Research and education only — not financial advice, and not a recommendation to buy, sell or hold any security. Analysis is generated with AI assistance from measured price data and may contain errors. Prices shown were accurate at the last update. Full terms · How we produce this