MongoDB, Inc. (MDB)
MongoDB is up 25.6% and sitting at 337.57 after beating earnings by 18 percentage points in early September. The stock has momentum on both the weekly and daily charts, though it's pulled back from its recent highs and faces meaningful resistance overhead.
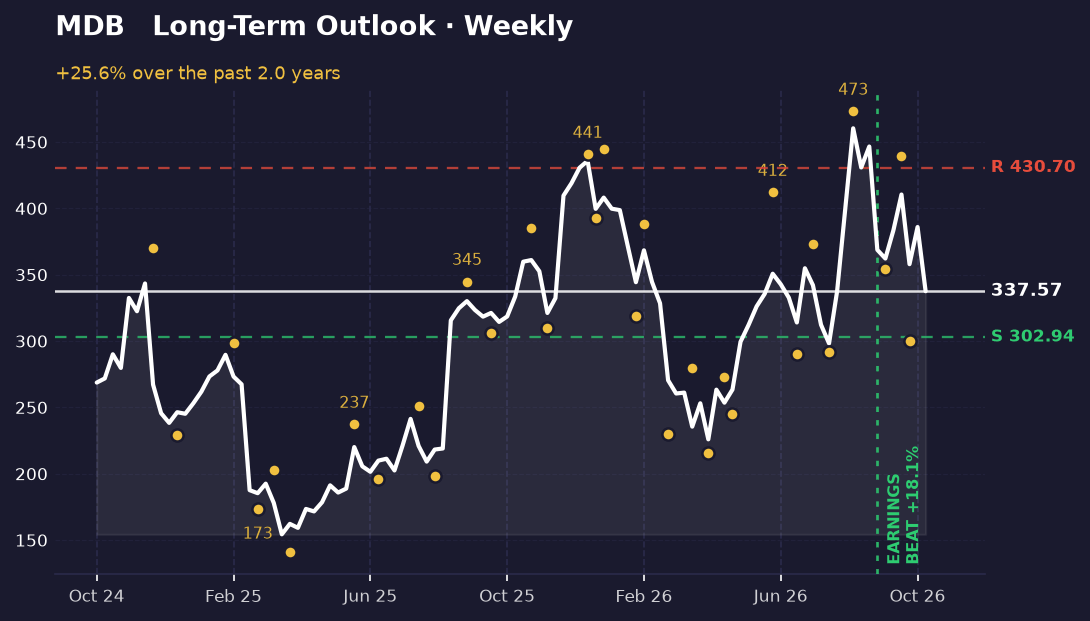
The long-term picture
Over the past several months, MongoDB has traced a clear uptrend punctuated by sharp swings. The stock peaked at 473.1 in mid-August, then fell to 354.11 by mid-September before rallying again to 439.75 at the end of that month. A fresh low of 300.0 came in early October, but the stock has since recovered. At 337.57, it's sitting 10.3% above the weekly support level of 302.94 and 27.6% below the resistance zone at 430.7. The earnings beat in early September appears to have provided a floor for the decline that followed.
The stock's position in its longer-term range is telling: it's 26.7% below the all-time high of 460.33 set during this period, but 118.6% above the low of 154.39. This suggests the uptrend remains intact despite the pullback, with the recent low at 300.0 acting as a pivot point that buyers have defended.
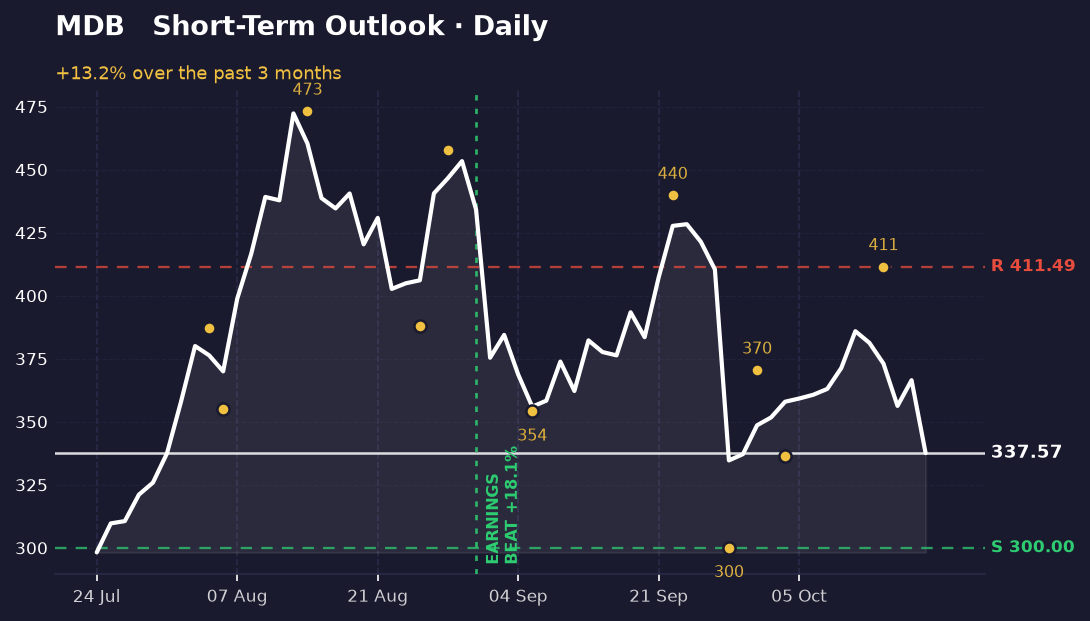
The short-term picture
On the daily chart, momentum is building. The stock has climbed 13.2% from its recent low of 298.22, and the most recent swing high of 411.49 (set in mid-October) sits just 21.9% above the current price. Support is tight at 300.0, only 11.1% below where the stock trades now. The daily picture is aligned with the weekly view—both are moving higher—which is a positive signal for continuation.
However, there's a gap between where price sits and where it needs to go to test resistance. The weekly resistance at 430.7 is still 27.6% away, and the daily resistance at 411.49 is 21.9% away. The stock has room to run before hitting either level, but momentum will need to sustain for that to happen.
What's driving it
MongoDB beat earnings by 18.09 percentage points on September 1st, a significant outperformance that appears to have anchored the stock's recovery from its subsequent decline. The earnings surprise is marked on both charts. Beyond that, Needham reiterated a Buy rating and maintained a 430 price target, suggesting analyst confidence in the upside. No other recent catalysts are evident from available headlines, so the current price action is being driven primarily by the earnings beat and the technical recovery that followed.
What would change this
A break below the weekly support at 302.94 would invalidate the current uptrend and suggest the earnings bounce has failed. That level is only 10.3% below the current price, so it's not far away—a move there would signal that buyers have lost conviction. On the upside, a sustained move above the weekly resistance at 430.7 would confirm the rally and open the door to testing the recent high of 473.1. That's 27.6% above current levels, so it would require meaningful momentum to reach it.
Key takeaways
- MongoDB beat earnings by 18 percentage points in early September and has rallied 25.6% since, with both weekly and daily charts aligned upward.
- The stock is 10.3% above weekly support at 302.94 but still 27.6% below resistance at 430.7, leaving room to run if momentum holds.
- Needham maintains a Buy rating with a 430 price target, aligning with the weekly resistance level the stock must clear to extend gains.
- The recent low at 300.0 has held as a pivot point, suggesting buyers are defending that level and supporting the recovery.
This one was our pick. The next one is yours.
You've just read the public write-up for MDB. A free account adds the full Pulse Report — the one that normally costs credits — on a symbol you choose, saved to your account and emailed to you.
- One full Pulse Report a week, on any symbol from the published list
- A five-symbol watchlist with live prices and signals
- Earnings dates, analyst targets, news and basic financials for what you follow
- Multi-timeframe charts with the indicators you choose
- Email alerts when something you're watching moves
- Deeper reports in three tiers when you want them — Pulse, Insight and Alpha
No card needed.
Research and education only — not financial advice, and not a recommendation to buy, sell or hold any security. Analysis is generated with AI assistance from measured price data and may contain errors. Prices shown were accurate at the last update. Full terms · How we produce this