Lumentum Holdings Inc. (LITE)
Lumentum is up nearly 6% over the past few days and sits well above its recent lows, but momentum has stalled. The stock is caught between a weekly uptrend that's been running for months and daily weakness that's keeping it pinned in a narrow range.
The long-term picture
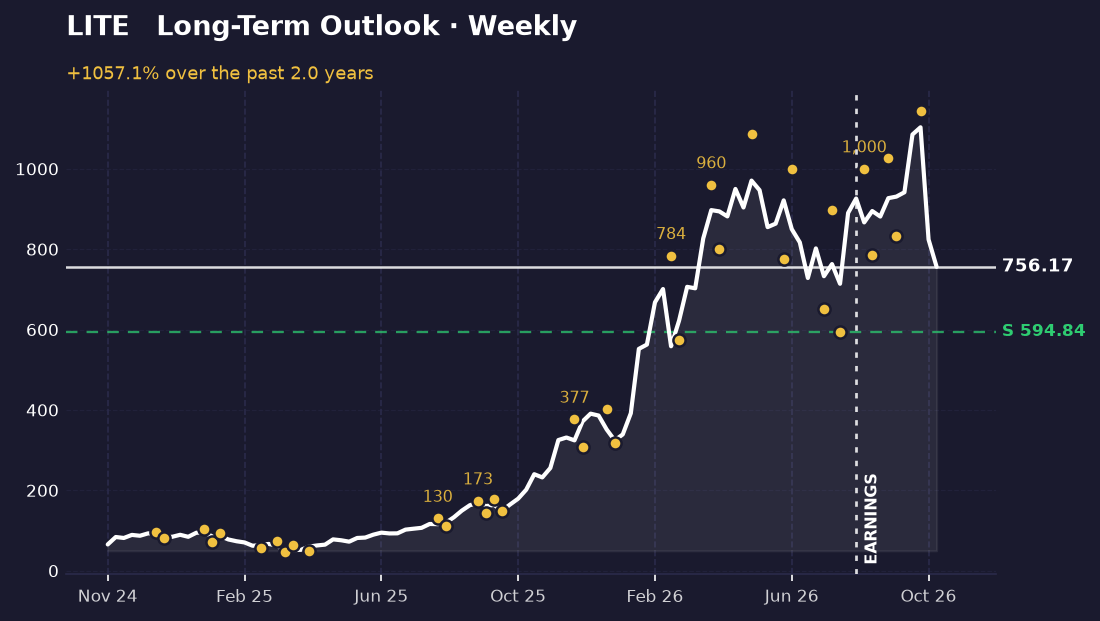
Over the past year, Lumentum has climbed from 65 to 756—a gain of over 1000%. The stock peaked at 1143 in early October, then pulled back to 832, and has since recovered to near current levels. This recovery sits 31.5% below that October high, but it's also 1426% above the lowest point the stock has ever reached in this period.
The weekly picture shows a stock in an established uptrend with defined swing points. Support sits at 595, and the stock is currently 21% above that level. There's no defined resistance on the weekly chart, which suggests the uptrend remains intact, but the distance from the October peak signals that momentum has cooled. Price is in the upper two-thirds of its all-time range, a position that typically requires fresh catalysts to push higher.
The short-term picture
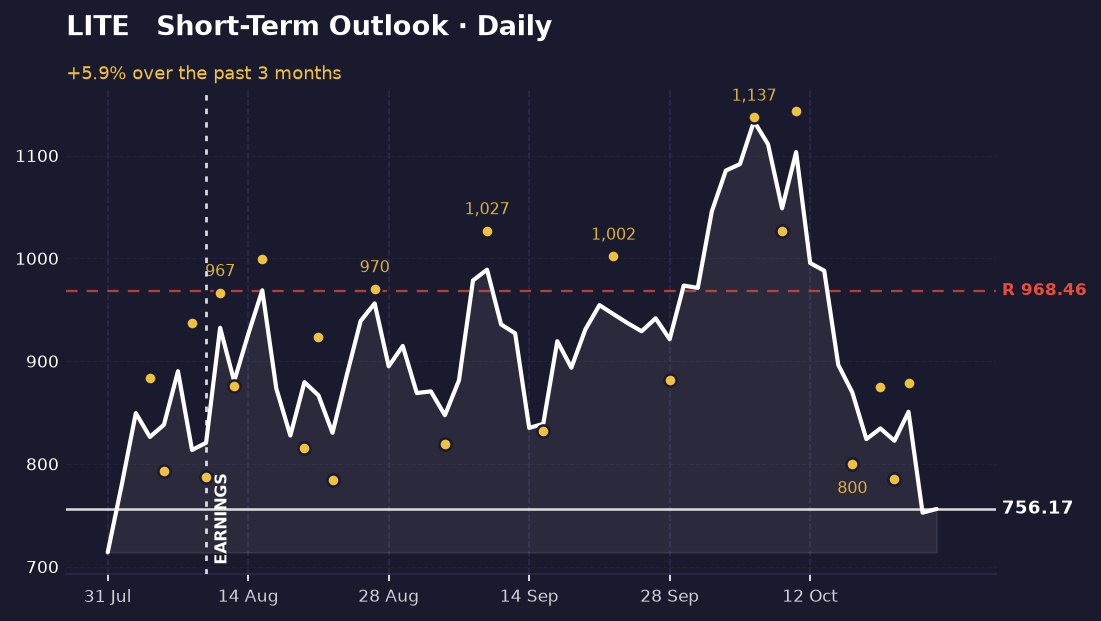
On a daily basis, the picture is more cautious. Over the past week, Lumentum has oscillated between 785 and 879, a tight 94-point range. The stock closed at 756, which puts it near the lower end of recent trading. Resistance sits at 968—about 28% above current price—and that level has not been tested since the October peak.
The daily timeframe agrees with the weekly view that the trend is up, but the narrow recent range and position near the bottom of that range suggest buyers have lost conviction. Momentum is neutral to slightly positive, but there's no sign of acceleration. A break above 879 would be needed to suggest the daily weakness is just a pause, not a reversal.
What's driving it
Lumentum reported earnings on August 11, marked on both charts. Since then, the stock has continued its climb, suggesting the market has been receptive to results. Jefferies recently maintained a Buy rating and raised its price target to 1250, well above current levels. That target implies significant upside if the stock can break through resistance and resume its earlier momentum. However, the telecom sector has faced headwinds—a recent headline noted that telecom stocks have hit their longest losing streak against the S&P 500, driven partly by competition from SpaceX. This sector pressure may be weighing on sentiment despite positive analyst views.
What would change this
The weekly uptrend would be invalidated if price closes below 595 support. That would represent a break of the major support level and would signal that the year-long rally has failed. On the daily side, a close below 785 would confirm that the recent narrow range is breaking to the downside, which would align with a broader weekly deterioration.
Conversely, a daily close above 879 would suggest the recent consolidation is over and buyers are ready to test resistance at 968. A break above 968 would open the path toward the October high of 1143 and validate the Jefferies price target of 1250. Until one of these levels breaks decisively, the stock remains in a holding pattern.
Key takeaways
- Lumentum has gained over 1000% in the past year but is 31.5% below its October peak of 1143.
- Weekly support at 595 is 21% below current price, providing a defined floor for the uptrend.
- Daily resistance at 968 is 28% above current price and has not been tested since the October high.
- Jefferies raised its price target to 1250, but telecom sector headwinds may be limiting near-term momentum.
This one was our pick. The next one is yours.
You've just read the public write-up for LITE. A free account adds the full Pulse Report — the one that normally costs credits — on a symbol you choose, saved to your account and emailed to you.
- One full Pulse Report a week, on any symbol from the published list
- A five-symbol watchlist with live prices and signals
- Earnings dates, analyst targets, news and basic financials for what you follow
- Multi-timeframe charts with the indicators you choose
- Email alerts when something you're watching moves
- Deeper reports in three tiers when you want them — Pulse, Insight and Alpha
No card needed.
Research and education only — not financial advice, and not a recommendation to buy, sell or hold any security. Analysis is generated with AI assistance from measured price data and may contain errors. Prices shown were accurate at the last update. Full terms · How we produce this