IREN LIMITED (IREN)
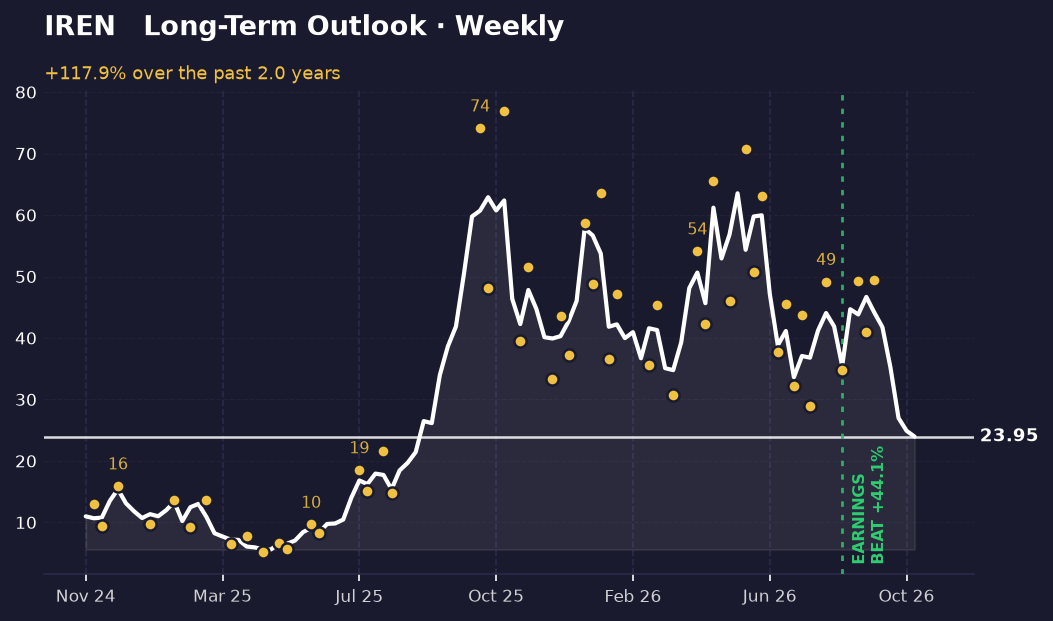
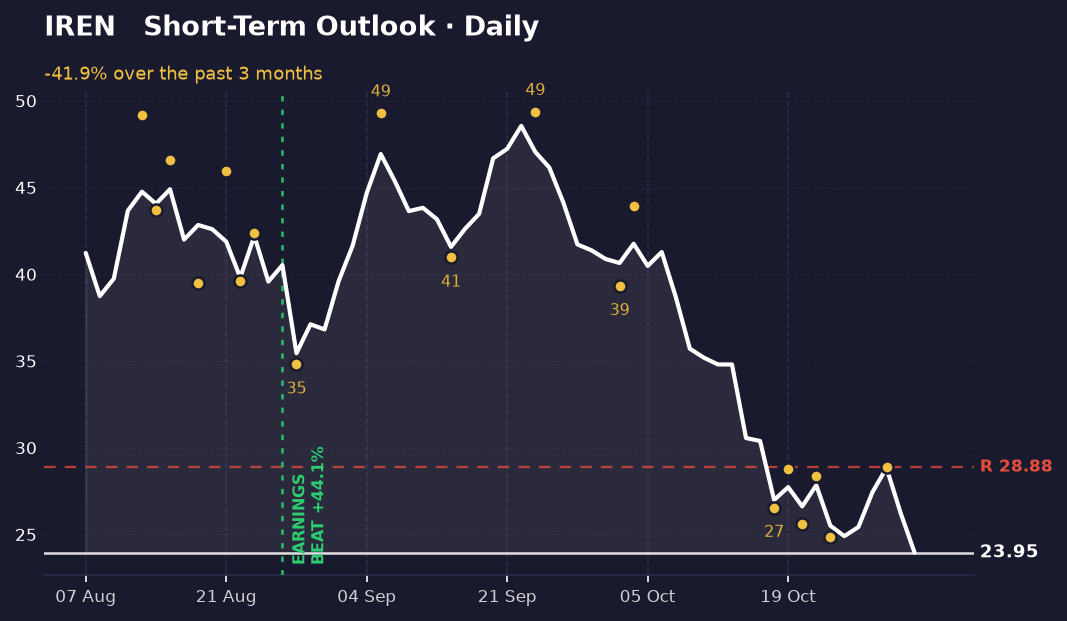
IREN has had a big run and then a sharp drop. Over the period we're looking at, the stock closed about 118% higher, from $10.99 to $23.95. But the most recent few weeks have gone the other way, down about 42% from $41.23. The two timeframes tell different stories, which is why this one is worth a closer look.
The long-term picture
On the weekly chart, the bigger picture is still a rise. Price climbed from a closing low of $5.59 to a closing high of $63.54 at its peak. From that high, the stock has since pulled back about 62%, and it now sits roughly 328% above its lowest close. That means it has given back a large share of the gain but has not returned to where the run started.
The swing points on this chart are based on intraday highs and lows rather than closing prices. Recent swing lows came in at $34.81 in late August and $40.97 in mid-September. Recent swing highs reached $49.29 in early September and $49.37 in late September. Each low has been higher than the one before it, and the rallies have stalled in roughly the same place near $49. That pattern is a pause at a ceiling, not a clear breakdown, but the ceiling has held twice now.
For the weekly read to stay intact, price would need to keep forming higher lows above that late-August low. The chart doesn't show a clear support level drawn in, so the swing lows are the reference points to watch.
The short-term picture
The daily chart is pointing down. Over the past several weeks, the stock has fallen steadily and is at the bottom of its recent closing range, $23.95, which is also its lowest close in the window. Momentum is weak, and there has been no sustained bounce yet.
Recent daily swings are tighter. The stock bottomed at $25.59 on October 20 and again at $24.86 on October 22, then rallied to $28.39 and later to $28.88 on October 28. That last high is the nearest resistance on this chart, about 21% above the latest close. Those two lows sit just above the current price, so the short-term view is still testing its floor.
This is where the two timeframes disagree. The weekly chart is still in a longer uptrend, while the daily chart is in a sharp recent decline. Neither view cancels the other. The conflict itself is the main thing to understand here.
What's driving it
The most recent earnings report was on August 27, 2026. It beat expectations by about 44%. That date is marked on both charts with a vertical line. The price moves after that report were part of the rise from late August into September, but the report alone doesn't explain the recent decline.
In the news, the headlines are mixed. B. Riley Securities kept its buy rating on IREN but lowered its price target to $64. IREN also closed a $363 million equipment financing deal with Blue Owl's Wingspire unit for its AI compute business. One headline asked why the stock fell on a Friday, but no specific cause is given in the material here, so I can't tie the recent slide to a particular event.
What would change this
The weekly read would weaken if price falls below the late-August swing low of $34.81. Breaking that level would end the pattern of higher lows and would put the longer uptrend in question.
The daily read would turn more positive if the stock closes above the $28.88 high from October 28. That would be the first higher high on the daily chart after a series of lower moves, and it would suggest the short-term decline is losing strength. Until then, the daily trend stays weak.
Key takeaways
- IREN is up about 118% over the period on the weekly chart but down about 42% over the last several weeks on the daily chart.
- The weekly chart's recent swing lows, $34.81 and $40.97, have been rising, and rallies have stalled near $49.
- On the daily chart, the nearest resistance is $28.88, about 21% above the latest close of $23.95.
- The weekly and daily views disagree, and a close above $28.88 or a break below $34.81 would be the next important signals.
This one was our pick. The next one is yours.
You've just read the public write-up for IREN. A free account adds the full Pulse Report — the one that normally costs credits — on a symbol you choose, saved to your account and emailed to you.
- One full Pulse Report a week, on any symbol from the published list
- A five-symbol watchlist with live prices and signals
- Earnings dates, analyst targets, news and basic financials for what you follow
- Multi-timeframe charts with the indicators you choose
- Email alerts when something you're watching moves
- Deeper reports in three tiers when you want them — Pulse, Insight and Alpha
No card needed.
Research and education only — not financial advice, and not a recommendation to buy, sell or hold any security. Analysis is generated with AI assistance from measured price data and may contain errors. Prices shown were accurate at the last update. Full terms · How we produce this