IonQ, Inc. (IONQ)
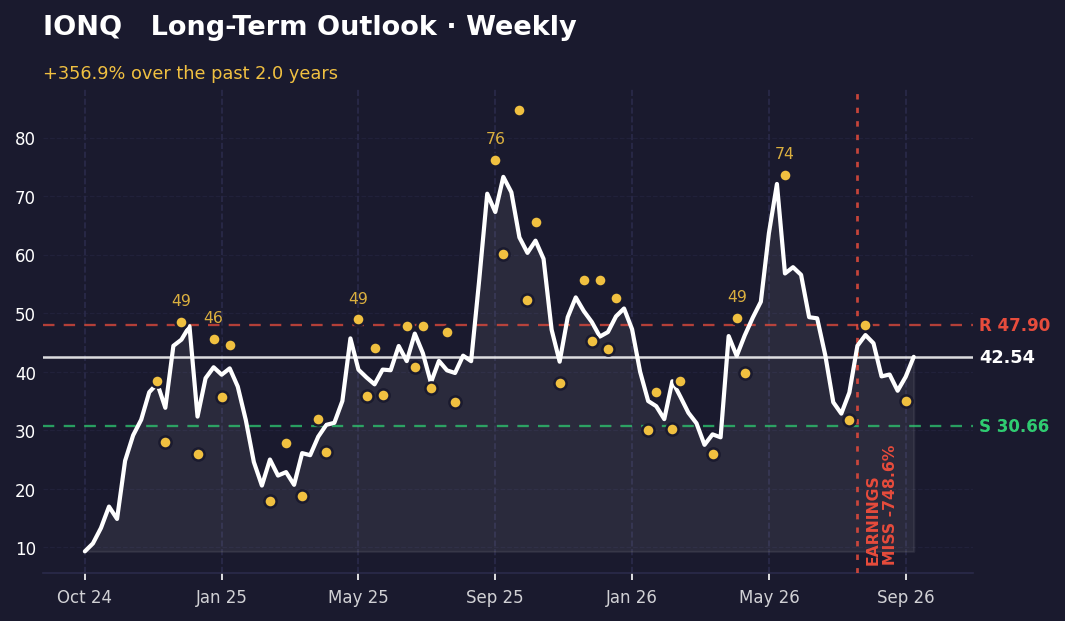
IonQ has climbed 357% from its starting point at $9.31 to $42.54, riding a wave of quantum computing enthusiasm and real technical progress. But the stock is caught between two conflicting signals right now: the weekly chart still shows an uptrend, while the daily chart is losing momentum after an earnings miss in early August.
The long-term picture
On the weekly view, IonQ has traced a clear uptrend from its lows. The stock peaked at $73.65 in June, then pulled back to $35.00 in mid-September before bouncing to $47.95 in late August. Today at $42.54, it sits 12.6% below the resistance level of $47.90 and 27.9% above support at $30.66. The stock is roughly in the middle of its closing range over this period, which means it hasn't decisively broken either direction yet.
The structure suggests the uptrend is still intact, but the recent lower high in September (compared to June's peak) hints that momentum may be cooling. The stock would need to reclaim $47.90 to confirm the uptrend is resuming; a break below $30.66 would signal a more serious shift.
The short-term picture
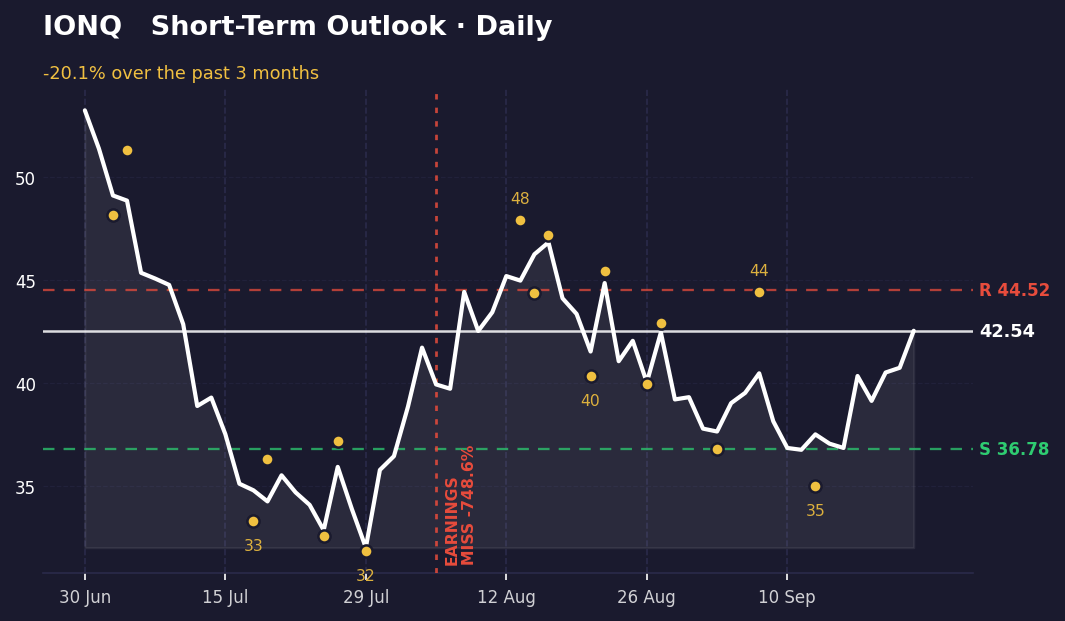
The daily picture tells a different story. Over the past month, IonQ has fallen 20.1% from $53.26 to $42.54, and it's now sitting just 4.7% below the daily resistance at $44.52. Support is much closer, at $36.78—only 13.5% below current price. This tight range suggests the stock is consolidating after its recent decline.
The conflict is real: the weekly chart wants to hold the uptrend, but the daily chart is showing weakness and is testing support. The earnings miss on August 5th appears to have triggered the selloff, and despite positive headlines about quantum breakthroughs and the NVIDIA partnership, the stock hasn't recovered decisively. A break below $36.78 on the daily chart would confirm that the short-term weakness is more serious than a simple pullback.
What's driving it
IonQ reported earnings on August 5th and missed expectations by a significant margin—the surprise was -748.58%. That miss coincides with the start of the recent decline. Since then, the narrative has shifted toward the positive: the company announced its first on-premise quantum deployment at NVIDIA's research center, and headlines have highlighted breakthroughs in real-time error correction. The broader quantum computing sector has caught a bid on these developments, lifting competitors like Rigetti. The tension between the earnings miss and the technical progress is playing out in the charts—positive momentum is there, but it hasn't yet overcome the damage from the August surprise.
What would change this
The weekly uptrend would be invalidated if IonQ closes below $30.66 support. That would signal the entire rally from the lows is in question and would likely trigger a retest of much lower levels. On the flip side, a daily close above $44.52 resistance would suggest the short-term weakness is just a pullback within the larger uptrend, and would open the door to a retest of the $47.90 weekly resistance.
The key to watching this stock is whether the positive headlines about quantum breakthroughs and the NVIDIA partnership can translate into price strength. Right now, the stock is at a crossroads: it's close enough to daily support that a break would be meaningful, but it's also close enough to daily resistance that a push through would confirm the uptrend is still alive.
Key takeaways
- IonQ has risen 357% from $9.31 to $42.54, but is down 20.1% from its recent high of $53.26 after an earnings miss in early August.
- Weekly chart shows an intact uptrend with support at $30.66 and resistance at $47.90; daily chart is weaker, with support at $36.78 and resistance at $44.52.
- The two timeframes are in conflict: weekly wants to hold the uptrend, daily is testing support after the earnings miss.
- Recent headlines about quantum breakthroughs and the NVIDIA partnership are positive, but haven't yet reversed the short-term momentum loss.
This one was our pick. The next one is yours.
You've just read the public write-up for IONQ. A free account adds the full Pulse Report — the one that normally costs credits — on a symbol you choose, saved to your account and emailed to you.
- One full Pulse Report a week, on any symbol from the published list
- A five-symbol watchlist with live prices and signals
- Earnings dates, analyst targets, news and basic financials for what you follow
- Multi-timeframe charts with the indicators you choose
- Email alerts when something you're watching moves
- Deeper reports in three tiers when you want them — Pulse, Insight and Alpha
No card needed.
Research and education only — not financial advice, and not a recommendation to buy, sell or hold any security. Analysis is generated with AI assistance from measured price data and may contain errors. Prices shown were accurate at the last update. Full terms · How we produce this