Intel Corporation (INTC)
Intel closed at 108.60 after a 95% earnings beat in late July, but momentum is now splitting between timeframes. The weekly chart still favors higher prices, while the daily picture shows recent weakness and a pullback that's testing near-term support. This disagreement is the key thing to watch.
The long-term picture
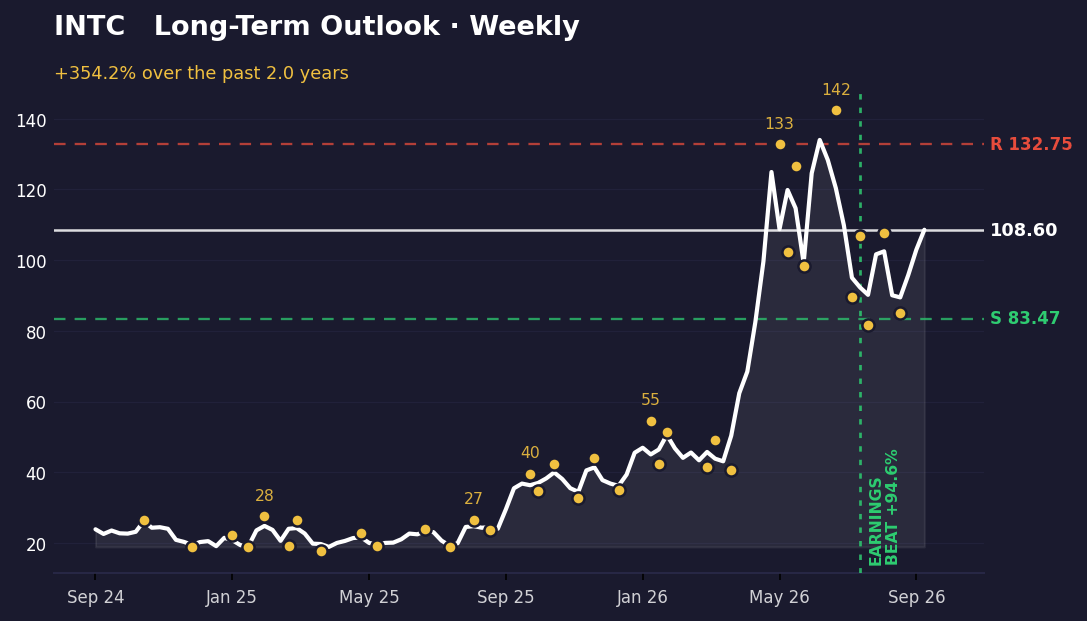
On the weekly chart, Intel has climbed 354% from its starting point, and price sits 23.1% above the support level of 83.47. The stock is 18.9% below its all-time high of 133.99, which marks the upper boundary of the current range. Recent swings show Intel bouncing between 81.79 and 107.57 over the past month—a pattern that suggests buyers are defending the lower end while sellers are capping gains near 107.
The resistance level at 132.75 remains the meaningful target on this timeframe. Price would need to clear that level to signal a fresh leg higher. For now, the weekly structure is intact: support is holding, and the stock sits in the upper half of its range, which is constructive. But the recent high of 107.57 on August 14 has not been exceeded, suggesting momentum may be consolidating rather than accelerating.
The short-term picture
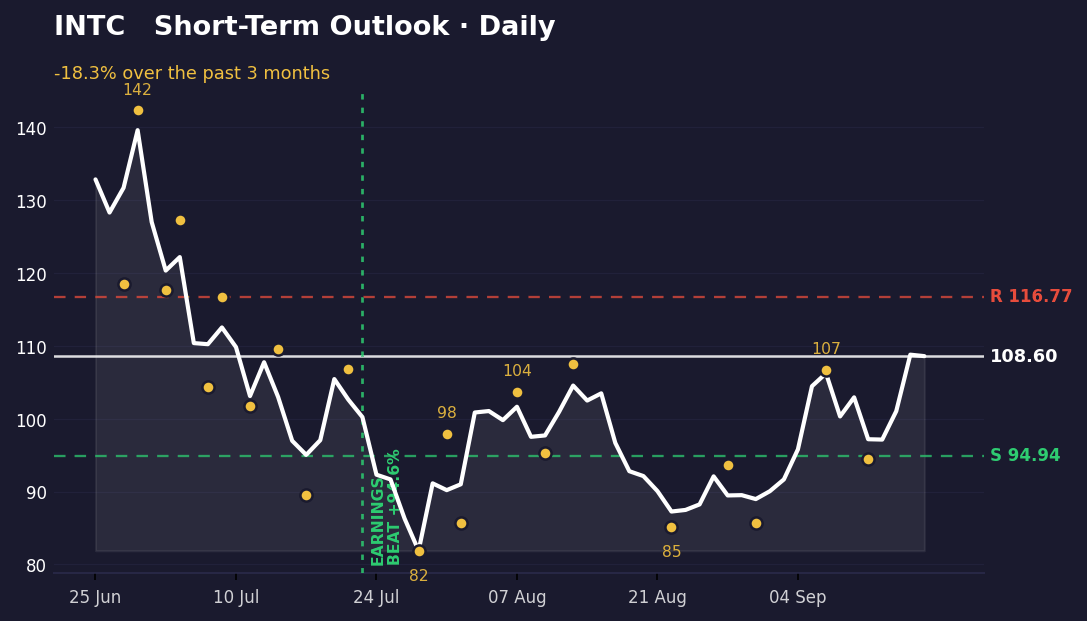
The daily chart tells a different story. Intel has fallen 18.3% from its recent high of 139.63, and it's now sitting just 12.6% above the daily support level of 94.94. The most recent swing low came on September 14 at 94.52, which is essentially at support. Price bounced to 106.69 on September 9, but has since retreated.
This is where the conflict matters: the weekly chart is still constructive, but the daily momentum has clearly weakened. Intel is only 7.5% below the daily resistance at 116.77, meaning it's trapped in a narrow band with support very close below. A break below 94.94 would signal that the daily weakness is becoming serious and would contradict the weekly bullish setup. Until that happens, the stock is consolidating, but the burden is on buyers to prove they can push back above 106.69 and then 116.77.
What's driving it
Intel beat earnings by 94.59% on July 23, which is marked on both charts. That surprise was substantial and helped fuel the initial rally. Since then, headlines have mentioned Intel alongside AMD and other chip stocks as key movers in a broader semiconductor rally, though no specific new catalyst has emerged in recent days. The stock is being watched as part of a wider conversation about AI compute and chip demand, but the recent pullback suggests that enthusiasm from the earnings beat may be cooling.
What would change this
A break below 94.94 on the daily chart would invalidate the weekly bullish read. That level is support, and losing it would mean the recent bounce from 85.72 has failed—a signal that selling pressure is stronger than the weekly structure suggests. Conversely, a sustained move above 116.77 on the daily chart would confirm that the weekly resistance at 132.75 is the real target and that the recent pullback was just a pause. Right now, Intel is in the middle ground, and the next directional move will come from which of these levels breaks first.
Key takeaways
- Intel beat earnings by 95% in late July but has since fallen 18.3% from its peak, creating a conflict between the bullish weekly chart and weakening daily momentum.
- Daily support at 94.94 is just 12.6% below current price; a break there would signal the weekly bullish case is breaking down.
- Weekly resistance at 132.75 remains 22.2% above current price and is the target if buyers can regain control on the daily timeframe.
- The stock is consolidating in a narrow band with the burden on buyers to prove they can push above 106.69 and then 116.77 on the daily chart.
This one was our pick. The next one is yours.
You've just read the public write-up for INTC. A free account adds the full Pulse Report — the one that normally costs credits — on a symbol you choose, saved to your account and emailed to you.
- One full Pulse Report a week, on any symbol from the published list
- A five-symbol watchlist with live prices and signals
- Earnings dates, analyst targets, news and basic financials for what you follow
- Multi-timeframe charts with the indicators you choose
- Email alerts when something you're watching moves
- Deeper reports in three tiers when you want them — Pulse, Insight and Alpha
No card needed.
Research and education only — not financial advice, and not a recommendation to buy, sell or hold any security. Analysis is generated with AI assistance from measured price data and may contain errors. Prices shown were accurate at the last update. Full terms · How we produce this