International Business Machines (IBM)
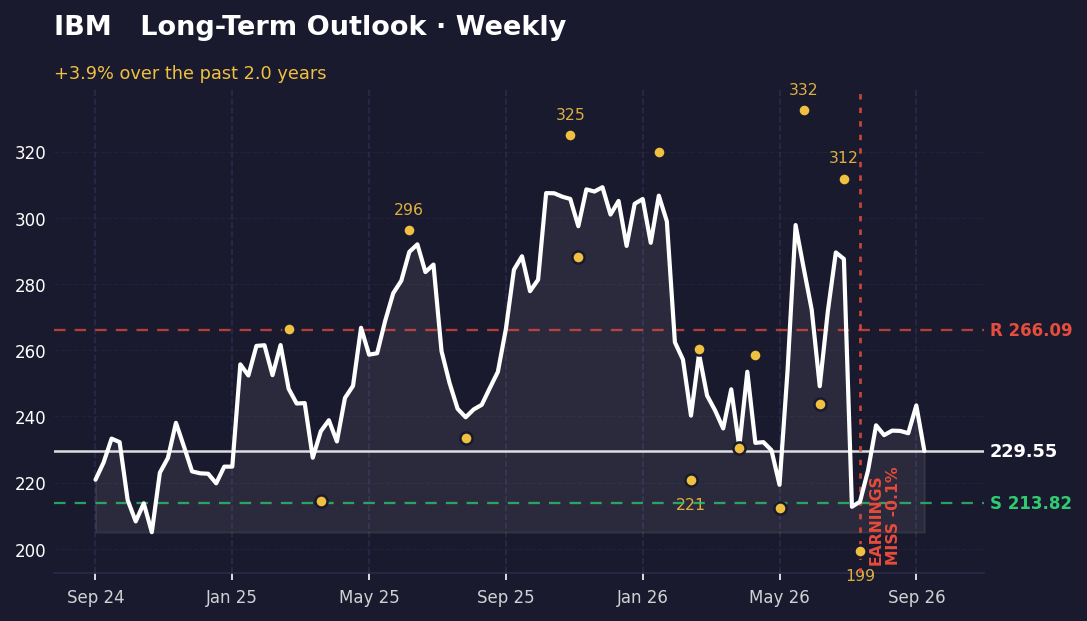
IBM closed at 229.55, caught between two opposing pictures. The weekly chart shows a gradual climb over months, but the daily view has rolled over sharply from a recent high. Understanding which one matters requires looking at where price sits inside each timeframe's structure.
The long-term picture
Over the past several months, IBM has traced a wide, volatile range between a low of 199.19 in late July and a high of 332.46 in early June. The stock is currently 25.8% below that June peak, but it's only 12% above the July low—sitting in the lower half of the overall range. Weekly support sits at 213.82; the stock is 6.9% above it. Resistance is at 266.09, about 15.9% above the current price.
The weekly trend itself is positive: the stock has climbed 3.9% from where it started this measurement period. However, that gain masks the volatility underneath. Price has swung between 243.68 and 311.8 in recent weeks, suggesting buyers and sellers are still testing the boundaries of where this stock belongs.
The short-term picture
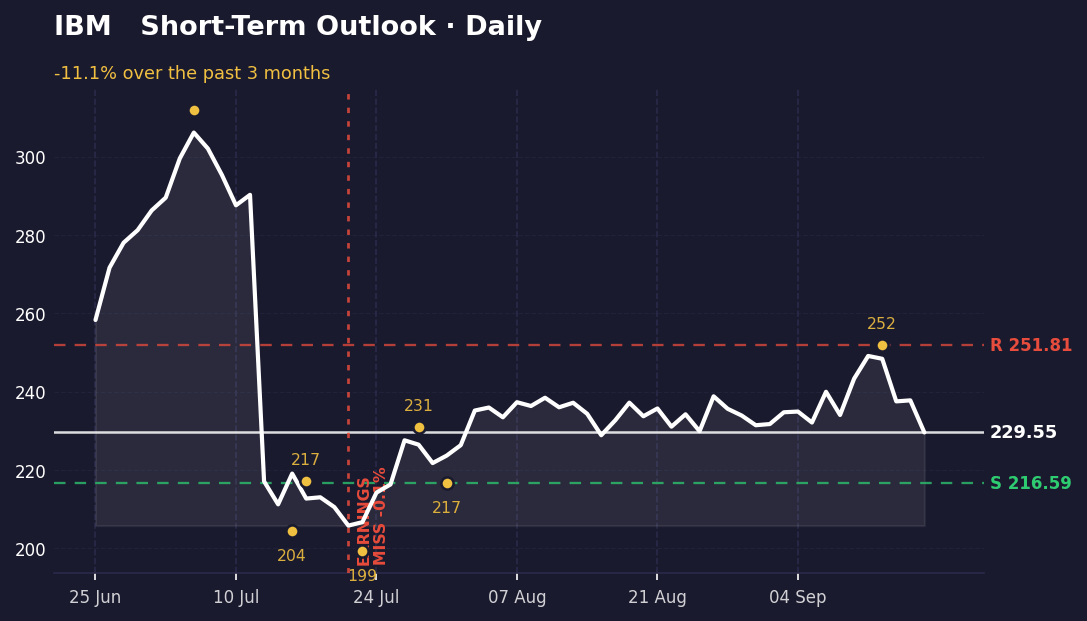
The daily picture tells a different story. Over the past few weeks, IBM has fallen 11.1% from an opening level of 258.27 down to 229.55. The most recent high came at 251.81 on September 15, and the stock has since pulled back 9.7% from that level. Daily support is at 216.59, just 5.6% below the current price—a tight margin.
This creates a direct conflict with the weekly view. While the weekly chart shows an uptrend, the daily chart is in a clear downtrend from its recent high. The stock is testing the lower end of its daily range, having fallen from 306.13 to 205.77 over the measurement period. If the daily weakness continues, the next test would be the 216.59 support level. A break below that would signal the daily decline is accelerating.
What's driving it
IBM reported earnings on July 22, missing expectations by 0.1%—a narrow miss that marked the start of the recent decline visible on both charts. The stock has not recovered to pre-earnings levels since. Recent headlines ask whether IBM is falling or breaking out, reflecting the confusion created by the conflicting timeframes. No major upcoming catalyst is supplied in the available news, so the current price action appears driven by the earnings disappointment and the market's reassessment of the stock's near-term direction.
What would change this
The weekly uptrend would be invalidated if price closes below the 213.82 support level on a weekly basis. That would signal the multi-month climb has failed and open the door to a retest of the 199.19 July low. Conversely, if the stock rallies back above 251.81 on the daily chart and holds there, it would begin to reconcile the two timeframes and suggest the weekly uptrend is reasserting itself. The next few weeks will determine whether this is a temporary pullback within a larger uptrend or the beginning of a deeper reversal.
Key takeaways
- Weekly chart shows IBM up 3.9% and trading above support at 213.82, but daily chart is down 11.1% from recent highs and testing 216.59 support.
- The stock is 25.8% below its June peak of 332.46 and sits in the lower half of its multi-month range.
- Earnings miss on July 22 marked the inflection point; the stock has not recovered since.
- Daily and weekly timeframes are in direct conflict—a break below 216.59 daily support would confirm the downtrend and threaten the weekly structure.
This one was our pick. The next one is yours.
You've just read the public write-up for IBM. A free account adds the full Pulse Report — the one that normally costs credits — on a symbol you choose, saved to your account and emailed to you.
- One full Pulse Report a week, on any symbol from the published list
- A five-symbol watchlist with live prices and signals
- Earnings dates, analyst targets, news and basic financials for what you follow
- Multi-timeframe charts with the indicators you choose
- Email alerts when something you're watching moves
- Deeper reports in three tiers when you want them — Pulse, Insight and Alpha
No card needed.
Research and education only — not financial advice, and not a recommendation to buy, sell or hold any security. Analysis is generated with AI assistance from measured price data and may contain errors. Prices shown were accurate at the last update. Full terms · How we produce this