CoreWeave, Inc. (CRWV)
CoreWeave is trading at $55.19, down nearly 50% over the past few weeks but holding just above its recent floor. The stock is caught between two opposing forces: a brutal weekly downtrend that's erased most of its gains since IPO, and a daily chart showing signs of stabilization. Understanding which one wins matters.
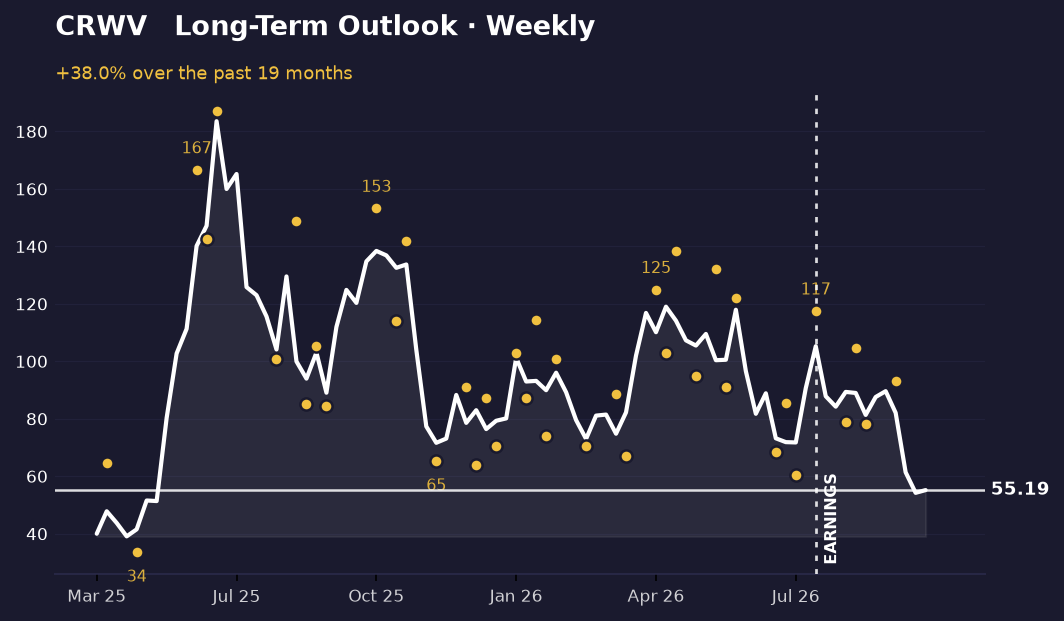
The long-term picture
On the weekly chart, CoreWeave has collapsed from a peak of $183.58 to $55.19—a 70% decline that puts the stock near the bottom of its entire range. The stock started at $40 and has spent most of its life between $79 and $104, a band it broke decisively to the downside in recent weeks. The current price sits just 41% above the lowest close ever recorded, suggesting we're near capitulation levels.
The recent swing pattern shows lower highs: the September high of $104.59 gave way to an October high of just $93.21, followed by a drop to $78.27. This is textbook weakness. The stock is now 69.9% below its all-time high, and there's no clear support level visible on the chart to suggest where a bounce might stick.
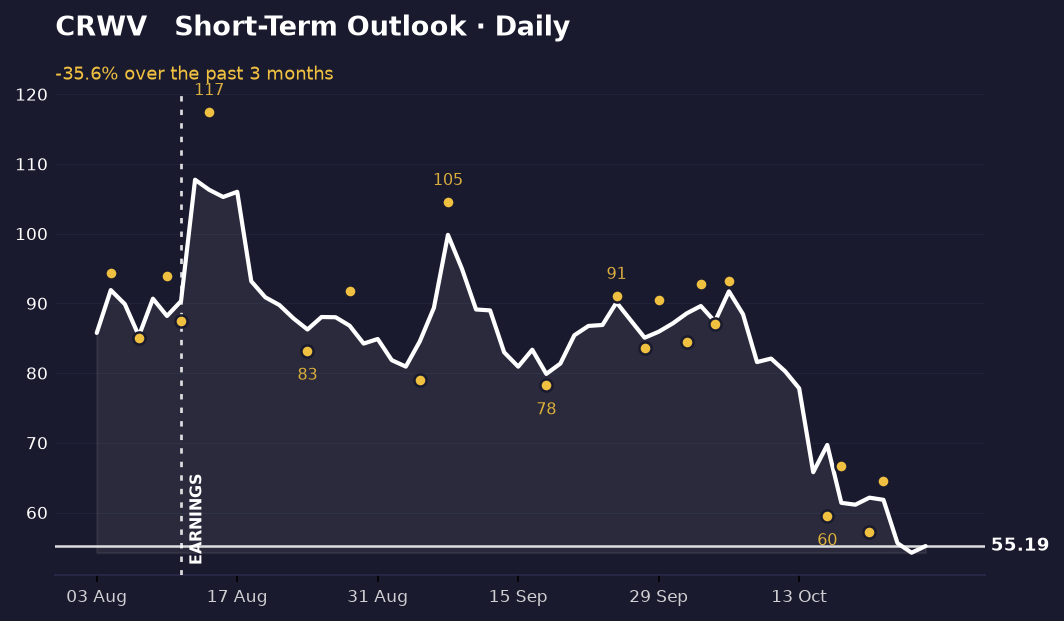
The short-term picture
The daily picture tells a different story. Over the past week, CoreWeave has bounced from a low of $57.23 on October 20 to $55.19 today, and intraday swings show it's been oscillating between roughly $57 and $65. The stock is sitting at the very bottom of its recent daily range—just 1.8% above the lowest close—which often marks exhaustion points where selling pressure eases.
Here's the conflict: the weekly chart shows a stock in free fall with no floor in sight, while the daily chart suggests buyers are stepping in near $57. These two timeframes are moving in opposite directions. The weekly downtrend is the dominant force, but the daily bounce is real. If the stock can hold above $57 and push back toward $65, it might stabilize. A break below $57 would confirm the weekly weakness and likely accelerate selling.
What's driving it
CoreWeave reported earnings on August 11, marked on both charts. Since then, the stock has faced conflicting narratives. The company announced a Denmark deployment and plans to extend its AI infrastructure network to the Middle East and Asia Pacific—growth moves that should support a cloud infrastructure story. However, recent headlines have shifted sharply: debt concerns have surfaced, with some commentary comparing the situation to past financial crises. Whale activity was noted in the stock today, suggesting large traders are positioning, though the direction remains unclear. The valuation concern—paying $63 for every $1 of sales—is also weighing on sentiment.
What would change this
The weekly picture breaks if CoreWeave closes above $93.21 for several weeks in a row. That level marks the recent swing high and would signal the downtrend is losing steam. A sustained move back toward $104 would suggest the collapse is over and a new uptrend is forming.
On the downside, a close below $54.23 (the lowest daily close on record in this dataset) would confirm the weekly weakness and likely trigger further selling toward the $40 IPO price. That would mean the entire post-IPO rally has been erased. Right now, the $57–$65 band is the battleground. The daily chart needs to hold $57 to keep the weekly collapse from accelerating.
Key takeaways
- CoreWeave is down 70% from its $183.58 peak but bouncing off lows near $55, creating a conflict between a collapsing weekly trend and a stabilizing daily chart.
- The weekly chart shows lower highs ($104.59 to $93.21) and no visible support, while the daily chart is oscillating tightly between $57 and $65 after recent selling pressure.
- Debt concerns and valuation questions ($63 per $1 of sales) are weighing on sentiment despite growth announcements in AI infrastructure deployment.
- The $57 level is critical: holding it keeps the daily bounce alive; breaking it confirms the weekly downtrend and risks a move back to the $40 IPO price.
This one was our pick. The next one is yours.
You've just read the public write-up for CRWV. A free account adds the full Pulse Report — the one that normally costs credits — on a symbol you choose, saved to your account and emailed to you.
- One full Pulse Report a week, on any symbol from the published list
- A five-symbol watchlist with live prices and signals
- Earnings dates, analyst targets, news and basic financials for what you follow
- Multi-timeframe charts with the indicators you choose
- Email alerts when something you're watching moves
- Deeper reports in three tiers when you want them — Pulse, Insight and Alpha
No card needed.
Research and education only — not financial advice, and not a recommendation to buy, sell or hold any security. Analysis is generated with AI assistance from measured price data and may contain errors. Prices shown were accurate at the last update. Full terms · How we produce this