Credo Technology Group Holding (CRDO)
Credo Technology has tripled since its IPO, but the stock is caught between two opposing forces right now. The weekly chart still shows an uptrend with support holding firm, while the daily chart has broken down sharply over the past week. Understanding which one wins matters.
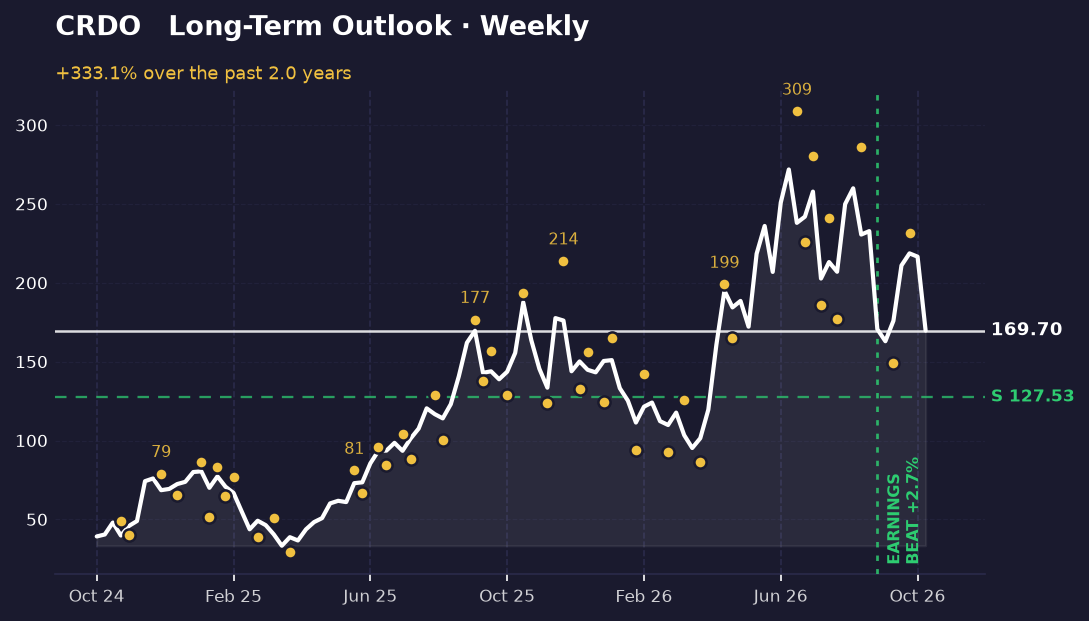
The long-term picture
Over the past year, Credo has traced a powerful climb from 39.18 to 169.70, with the stock reaching as high as 271.83 in August before pulling back. The recent pattern shows a series of swings: a low of 177.0 in late July, a peak at 286.24 in mid-August, a dip to 149.14 in mid-September, and a recovery to 231.59 in early October. Today's price of 169.70 sits 37.6% below that August peak, but it's still 24.8% above the weekly support level of 127.53. The stock is roughly in the middle of its year-long range, which means there's room to move in either direction before the structure breaks.
The earnings beat on September 1st didn't spark a sustained rally, suggesting the market is weighing broader sector headwinds. Chip stocks have endured their longest losing streak since 2006, and concerns about data center credit conditions are weighing on the group. For Credo specifically, the weekly chart hasn't broken down yet—support is still intact—but the momentum has clearly shifted.
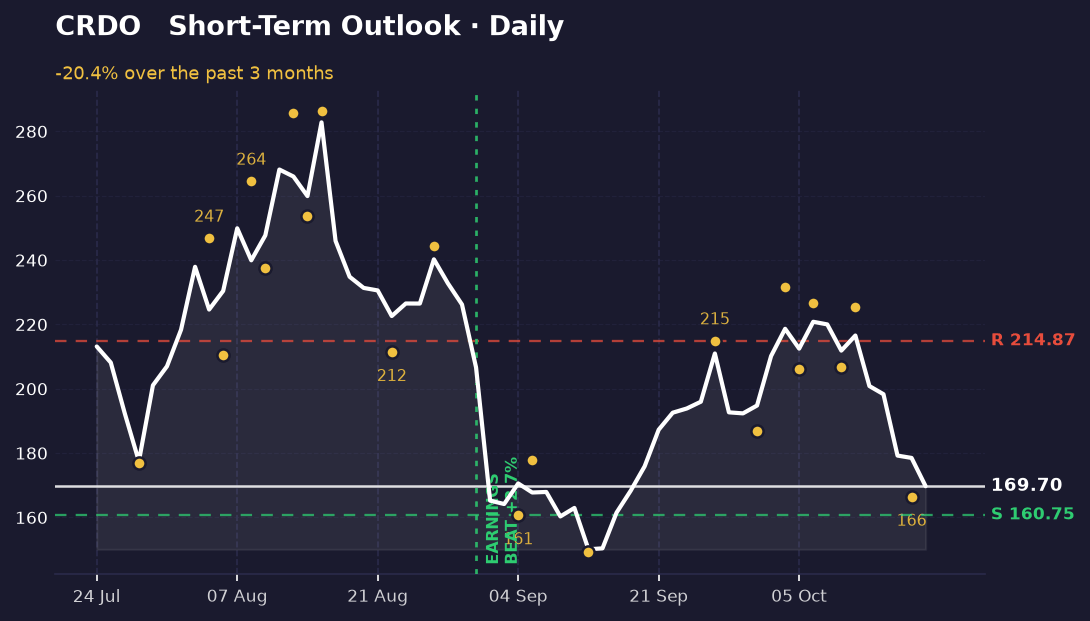
The short-term picture
The daily picture is much weaker. Over the past two weeks, the stock has fallen 20.4% from 213.15 to 169.70, and it's now sitting just 5.3% above the daily support level of 160.75. The recent swings tell the story: a high of 226.6 on October 6th, followed by a low of 206.66 two days later, then a brief bounce to 225.29, and finally a sharp drop to 166.5 on October 15th. That last move broke through several near-term support levels and left the stock vulnerable.
This directly conflicts with the weekly view. While the weekly chart still has room to fall before support breaks, the daily momentum has already turned negative. The stock is now 40% below its recent daily high and only 13.1% above its recent daily low. Resistance sits at 214.87—a level the stock has failed to hold twice in the past week. Until the daily chart stabilizes above 160.75, the short-term trend remains down, even if the longer-term structure hasn't cracked.
What's driving it
Credo beat earnings expectations by 2.69% on September 1st, but the stock has sold off since then, suggesting the market is focused on sector-wide pressures rather than company-specific strength. The broader chip sector is enduring its longest losing streak since 2006, with credit concerns around data center infrastructure providers like CoreWeave adding to the pressure. On the positive side, Credo has announced new products—the OmniConnect Weaver Memory Fanout Gearbox for AMD's Versal AI platform and a short-reach micro-emitter optics workstream targeting 2027 approval under the Open Compute Project. These are real developments, but they haven't reversed the near-term selling.
What would change this
The daily breakdown would be invalidated if the stock holds above 160.75 and rallies back above 214.87 resistance. That would suggest the recent drop was a pullback within a larger uptrend, not the start of a deeper decline. Conversely, if the stock breaks below 160.75 on the daily chart, the next support to watch is the weekly level of 127.53—a 25% drop from here. Breaking that would mean the entire year-long uptrend is in question. On the upside, a move back above 231.59 (the October 2nd high) would signal that the weekly structure is reasserting itself and the daily selloff was temporary.
Key takeaways
- CRDO has gained 333% from IPO but is down 20% over the past two weeks, creating a conflict between weekly support at 127.53 and daily weakness below 160.75.
- The stock is only 5.3% above daily support and 40% below its recent daily high, leaving little room for error in the short term.
- Earnings beat in September didn't hold, and sector-wide chip weakness is outweighing company-specific product announcements for now.
- Weekly support at 127.53 remains the key level—breaking it would invalidate the entire year-long uptrend.
This one was our pick. The next one is yours.
You've just read the public write-up for CRDO. A free account adds the full Pulse Report — the one that normally costs credits — on a symbol you choose, saved to your account and emailed to you.
- One full Pulse Report a week, on any symbol from the published list
- A five-symbol watchlist with live prices and signals
- Earnings dates, analyst targets, news and basic financials for what you follow
- Multi-timeframe charts with the indicators you choose
- Email alerts when something you're watching moves
- Deeper reports in three tiers when you want them — Pulse, Insight and Alpha
No card needed.
Research and education only — not financial advice, and not a recommendation to buy, sell or hold any security. Analysis is generated with AI assistance from measured price data and may contain errors. Prices shown were accurate at the last update. Full terms · How we produce this