Corcept Therapeutics Incorporat (CORT)
Corcept Therapeutics has climbed 80% from its low of $32.15, but the stock is now caught between two opposing forces. The weekly chart still shows strength, while the daily chart is in a sharp pullback that's erased a month of gains. The conflict matters because it tells you whether this is a healthy pause or the start of something worse.
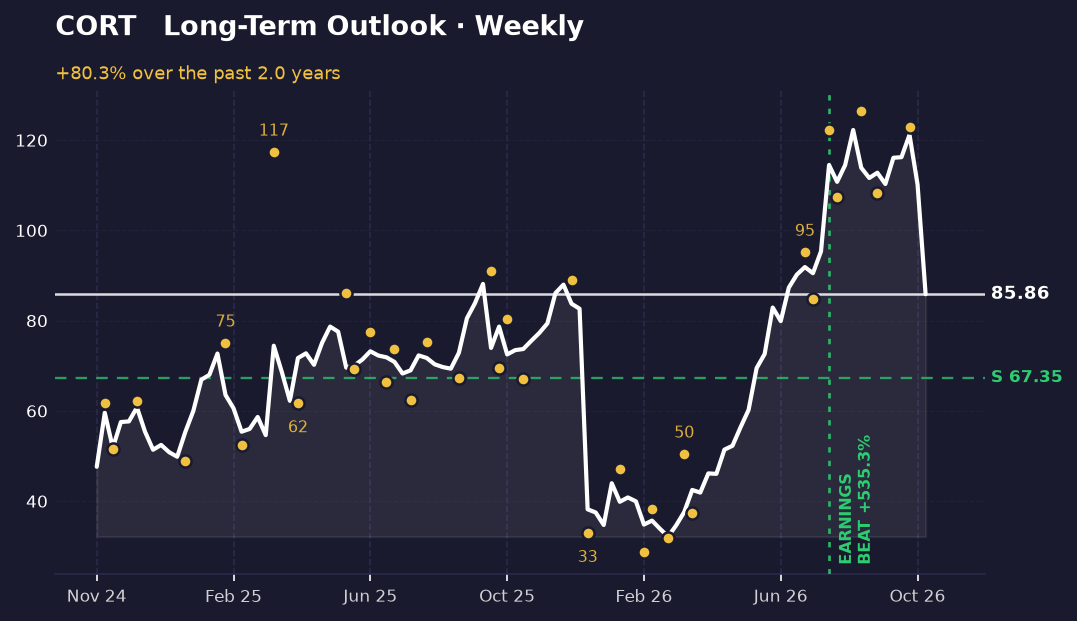
The long-term picture
On the weekly chart, Corcept has built a clear uptrend over the past year, moving from $47.62 to $85.86. The stock peaked at $122.25 and has since pulled back, but it's still sitting 21.6% above the support level of $67.35. Recent swings show the stock bouncing between $108 and $126 over the past two months—a tight, elevated range that suggests buyers are defending higher levels.
The stock is currently 29.8% below its all-time high on this chart, which is a meaningful pullback but not a breakdown. As long as it holds above $67.35, the weekly structure remains intact. That support level is where the longer-term trend would genuinely break.
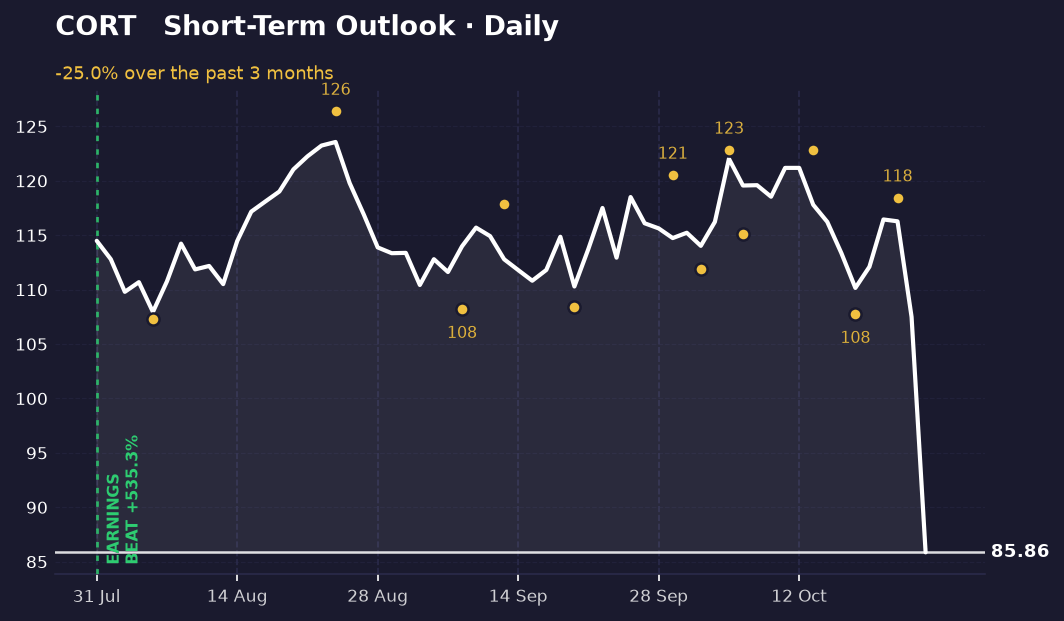
The short-term picture
The daily picture is much weaker. The stock has fallen 25% from its recent high of $123.57 and is now sitting at the absolute bottom of its recent range at $85.86. Over the past two weeks, it's swung between $107.79 and $122.81, but the most recent move has been straight down. This is a sharp reversal from the strength seen just days ago.
Here's the conflict: the weekly chart suggests the pullback is normal and contained, but the daily chart shows momentum breaking down hard. The stock is 30.5% below its recent daily high, and there's no clear support level marked on the daily timeframe yet. If this weakness continues, the next test will be whether the stock can hold the weekly support at $67.35, which is now 21% below current levels.
What's driving it
Corcept reported earnings on July 29 and beat expectations by 535%, a massive surprise that's marked on both charts. More recently, the American Diabetes Association and European Association for the Study of Diabetes issued a consensus recommendation for hypercortisolism screening in patients with difficult-to-control type 2 diabetes, citing Corcept's CATALYST mifepristone trial. This is a clinical endorsement that could expand the addressable market for the company's lead drug.
The earnings beat clearly drove the stock higher through August and September. The ADA/EASD recommendation is newer and should be supportive, but it hasn't stopped the recent selloff. The disconnect suggests that near-term price action is being driven by something other than the clinical news—possibly profit-taking after the 80% run, or broader market rotation.
What would change this
A break below $67.35 on the weekly chart would invalidate the bullish structure entirely. That level has held as support through the recent pullback, and losing it would mean the uptrend is over and a new downtrend is beginning. On the daily chart, a close above $118 would suggest the selling pressure is easing and the stock is stabilizing; anything below $85.86 would confirm the weakness is accelerating.
The key question is whether the daily breakdown is a correction within the weekly uptrend, or the start of a larger reversal. The weekly support at $67.35 will answer that. If the stock bounces there, the bullish case holds. If it breaks through, the entire 80% gain is at risk.
Key takeaways
- Corcept is up 80% from its low but down 25% from its recent peak, creating a conflict between weekly strength and daily weakness.
- Weekly support at $67.35 is 21% below the current price and represents the level where the longer-term uptrend would genuinely break.
- The stock beat earnings by 535% in July and just received a major clinical endorsement from the ADA and EASD, but neither has stopped the recent selloff.
- The daily chart shows momentum breaking down hard with no clear support, while the weekly chart suggests the pullback is contained within a healthy uptrend.
This one was our pick. The next one is yours.
You've just read the public write-up for CORT. A free account adds the full Pulse Report — the one that normally costs credits — on a symbol you choose, saved to your account and emailed to you.
- One full Pulse Report a week, on any symbol from the published list
- A five-symbol watchlist with live prices and signals
- Earnings dates, analyst targets, news and basic financials for what you follow
- Multi-timeframe charts with the indicators you choose
- Email alerts when something you're watching moves
- Deeper reports in three tiers when you want them — Pulse, Insight and Alpha
No card needed.
Research and education only — not financial advice, and not a recommendation to buy, sell or hold any security. Analysis is generated with AI assistance from measured price data and may contain errors. Prices shown were accurate at the last update. Full terms · How we produce this