Coinbase Global, Inc. (COIN)
Coinbase is up 36% over the past few days and just hit a new high for this recent move at $195.85. The stock is still more than halfway below its all-time high of $420, but it's climbing steadily from a July low of $139. The question now is whether this momentum can push through the next resistance level or fade.
The long-term picture
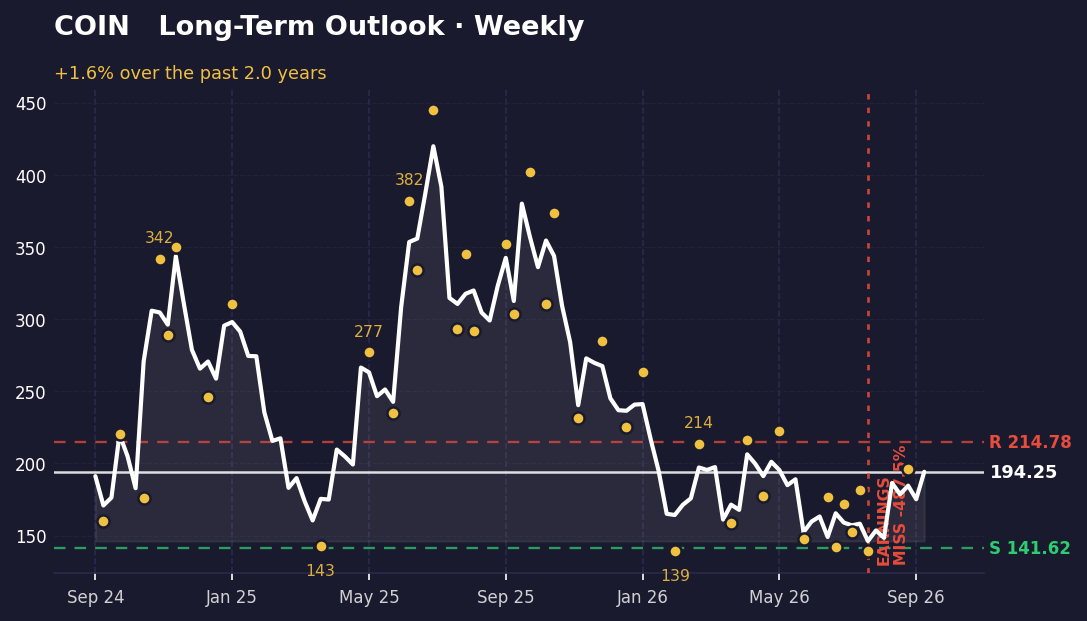
On the weekly chart, Coinbase has traced a clear recovery pattern since bottoming at $139.11 on July 31st. The stock climbed to $195.85 in early September, pulled back slightly, and is now sitting at $194.25. That puts it 27% above the support level of $141.62 and just 10.6% below resistance at $214.78. The overall range from the $139 low to the $420 peak shows the stock is still in the lower third of its historical trading band, but the direction has been firmly upward for the past six weeks.
The weekly momentum is constructive. Each swing low has been higher than the previous one—from $152.58 in mid-July to $139.11 at the end of July—and the recent high of $195.85 suggests buyers are in control. Breaking above $214.78 would be the next meaningful test; holding above $141.62 would confirm the support is real.
The short-term picture
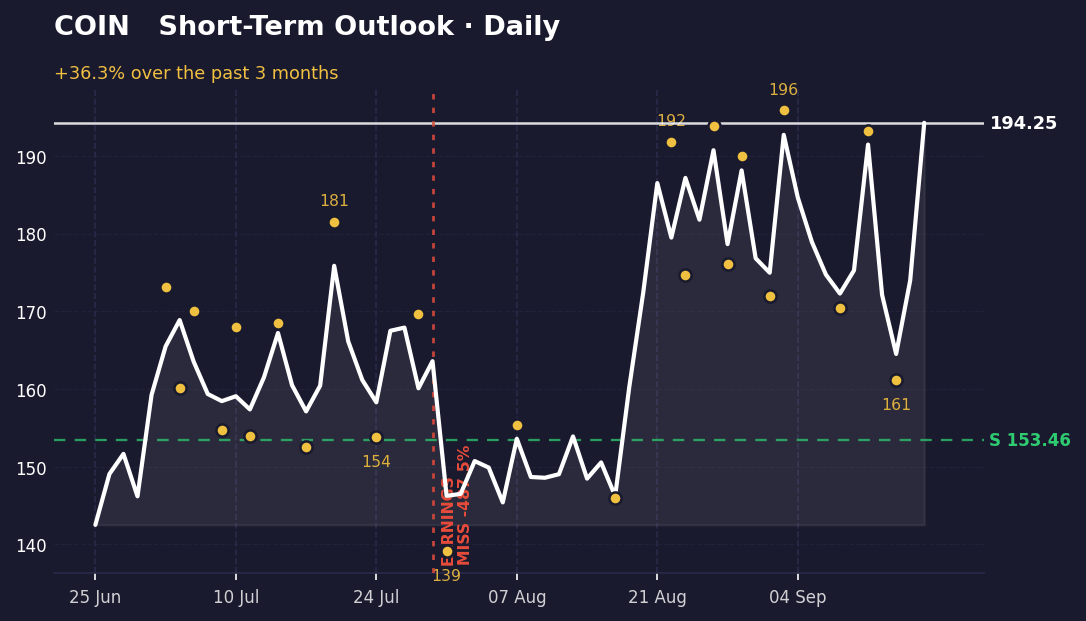
The daily picture is even more bullish. Coinbase has surged 36% from its recent low of $142.52, and it's now sitting at the very top of its recent range at $194.25. The most recent pullback only dipped to $161.18 on September 16th before bouncing sharply, and the stock is now 21% above the daily support level of $153.46. This agrees with the weekly view—both timeframes are moving in the same direction.
The daily momentum is strong, but it's also stretched. The stock is at the highest close of its recent moves, which means there's no room to go up without breaking into new territory. The next resistance isn't defined on the daily chart, so the $214.78 weekly resistance becomes the practical target. A drop below $153.46 would signal the bounce has failed and suggest a retest of the $139 weekly support.
What's driving it
Coinbase reported earnings on July 30th and missed expectations by a significant margin—the surprise was -487%. That miss is marked on both charts and likely triggered the sharp drop to $139 that followed. Since then, the recovery has been driven by regulatory optimism rather than company-specific news. The CFTC's proposal for crypto regulations and the SEC's amendment to tokenized stock trading rules have both supported the sector. Anthony Scaramucci's recent defense of CEO Brian Armstrong suggests some institutional confidence, though the CLARITY Act stalling is a headwind. The Fed's rate decisions and broader market moves are also in play, but the immediate catalyst for the current rally appears to be regulatory clarity rather than a change in Coinbase's fundamentals.
What would change this
The weekly resistance at $214.78 is the critical level. If Coinbase breaks above it decisively, the read shifts from "recovery bounce" to "sustained uptrend," and the next target becomes the $419.78 all-time high—a much longer journey, but a different story. Conversely, if the stock falls below the daily support at $153.46, it would suggest the bounce is exhausted and a retest of the $139.11 weekly low is likely. That would invalidate the constructive momentum picture and signal that the July earnings miss still has more downside to work through. The zone between $153 and $195 is where the current trade is being decided.
Key takeaways
- COIN has recovered 36% from its $142.52 low in just days and is now at $194.25, near the top of its recent range.
- Weekly support sits at $141.62 and resistance at $214.78; the stock is 27% above support and 10.6% below resistance.
- Both daily and weekly momentum are aligned and moving upward, but the stock is still 54% below its $420 all-time high.
- The July earnings miss triggered the initial drop, but recent regulatory optimism from the CFTC and SEC has fueled the recovery.
This one was our pick. The next one is yours.
You've just read the public write-up for COIN. A free account adds the full Pulse Report — the one that normally costs credits — on a symbol you choose, saved to your account and emailed to you.
- One full Pulse Report a week, on any symbol from the published list
- A five-symbol watchlist with live prices and signals
- Earnings dates, analyst targets, news and basic financials for what you follow
- Multi-timeframe charts with the indicators you choose
- Email alerts when something you're watching moves
- Deeper reports in three tiers when you want them — Pulse, Insight and Alpha
No card needed.
Research and education only — not financial advice, and not a recommendation to buy, sell or hold any security. Analysis is generated with AI assistance from measured price data and may contain errors. Prices shown were accurate at the last update. Full terms · How we produce this