Constellation Energy Corporatio (CEG)
Constellation Energy closed at 271.37, roughly halfway between its 52-week low of 170.96 and its peak of 389.19. The stock is caught in a disagreement between its weekly and daily charts—one showing resilience near resistance, the other showing momentum fading. That tension is worth understanding before the next move.
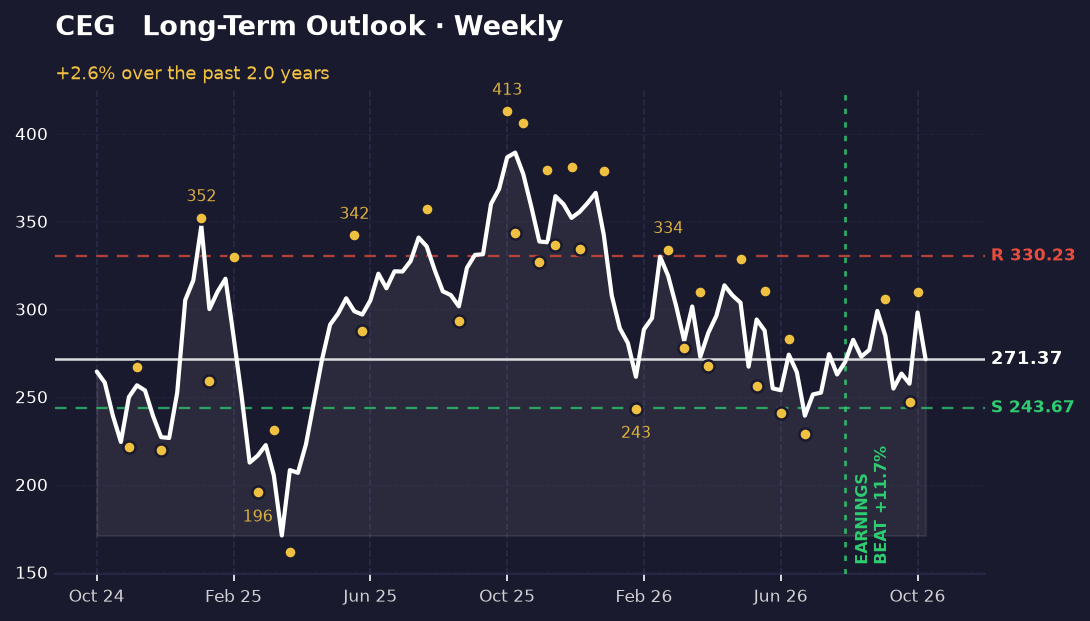
The long-term picture
On the weekly chart, CEG has spent the past few months oscillating between 228.63 and 309.8, with the most recent high at 309.8 on October 9th. The stock is now 21.7% below its resistance level of 330.23, but only 10.2% above support at 243.67. This positioning suggests the stock is in the middle of its recent range, neither extended nor oversold. The August earnings beat (11.73% surprise) marked a turning point, and price has climbed steadily since, suggesting institutional interest remains intact.
The weekly structure is constructive. Each swing low over the past three months has been higher than the one before—a textbook sign of an uptrend. The stock would need to break below 243.67 to signal a meaningful shift in that bias. Until then, the weekly picture reads as a stock consolidating gains and building a base for a potential run toward 330.23 and beyond.
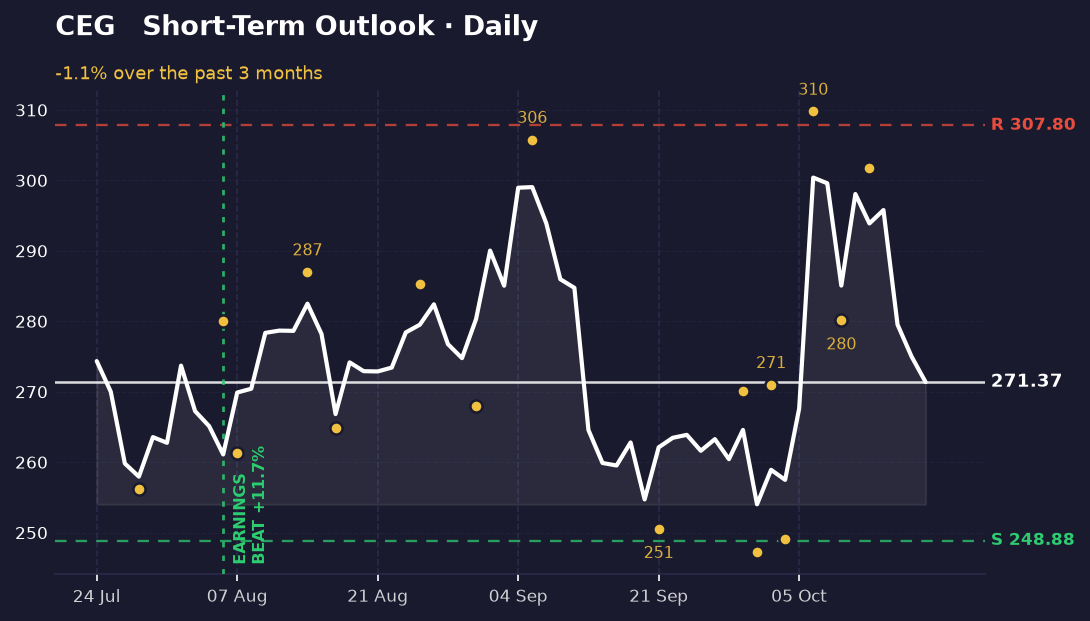
The short-term picture
The daily chart tells a different story. CEG peaked at 301.77 on October 12th, then retreated to 280.16 two days later. It's now sitting at 271.37, down 1.1% from where it opened this period. More importantly, it's only 6.8% above its recent daily low of 254.02 and 13.4% below daily resistance at 307.8. Momentum has clearly stalled.
This is where the conflict matters. The weekly chart wants higher prices; the daily chart is showing sellers stepping in near 300. The stock is now closer to its daily support at 248.88 than to its daily resistance at 307.8. If the daily weakness persists and price breaks below 248.88, it would undermine the weekly uptrend and suggest the consolidation is breaking down rather than building up.
What's driving it
Constellation beat earnings expectations by 11.73% on August 6th, and that beat coincided with a sustained rally. More recently, CIBC initiated coverage with an Outperformer rating and a 358 price target—a level that sits 31.9% above the current price and would require a break above the weekly resistance at 330.23. No imminent earnings date is supplied, so the near-term driver is likely sentiment around nuclear energy demand and the credibility of that analyst call. The gap between the current price and the 358 target is substantial enough to matter to traders watching for confirmation.
What would change this
The weekly read breaks if CEG closes below 243.67. That level represents the low from October 2nd and is the floor of the recent consolidation. A break there would signal that the uptrend has failed and that the stock is rolling over into a broader decline. Conversely, the daily weakness becomes irrelevant if price reclaims 307.8 and pushes toward 330.23. That move would confirm the weekly bias and suggest the recent pullback was just a rest, not a reversal. Watch the next few days closely: a hold above 260 keeps the weekly structure intact, while a drop below 255 starts to look dangerous.
Key takeaways
- CEG is 30% below its all-time high of 389.19 but has held an uptrend since an August earnings beat, with each swing low higher than the last.
- Weekly and daily charts are in direct conflict: the weekly wants higher prices toward 330.23, while the daily is showing momentum fade near 300.
- Support at 243.67 (weekly) and 248.88 (daily) are the levels that would invalidate the uptrend if broken; resistance at 330.23 is the next target if the weekly bias holds.
- CIBC's 358 price target implies a 31.9% move from current levels and requires a sustained break above weekly resistance to be credible.
This one was our pick. The next one is yours.
You've just read the public write-up for CEG. A free account adds the full Pulse Report — the one that normally costs credits — on a symbol you choose, saved to your account and emailed to you.
- One full Pulse Report a week, on any symbol from the published list
- A five-symbol watchlist with live prices and signals
- Earnings dates, analyst targets, news and basic financials for what you follow
- Multi-timeframe charts with the indicators you choose
- Email alerts when something you're watching moves
- Deeper reports in three tiers when you want them — Pulse, Insight and Alpha
No card needed.
Research and education only — not financial advice, and not a recommendation to buy, sell or hold any security. Analysis is generated with AI assistance from measured price data and may contain errors. Prices shown were accurate at the last update. Full terms · How we produce this