BlackBerry Limited (BB)
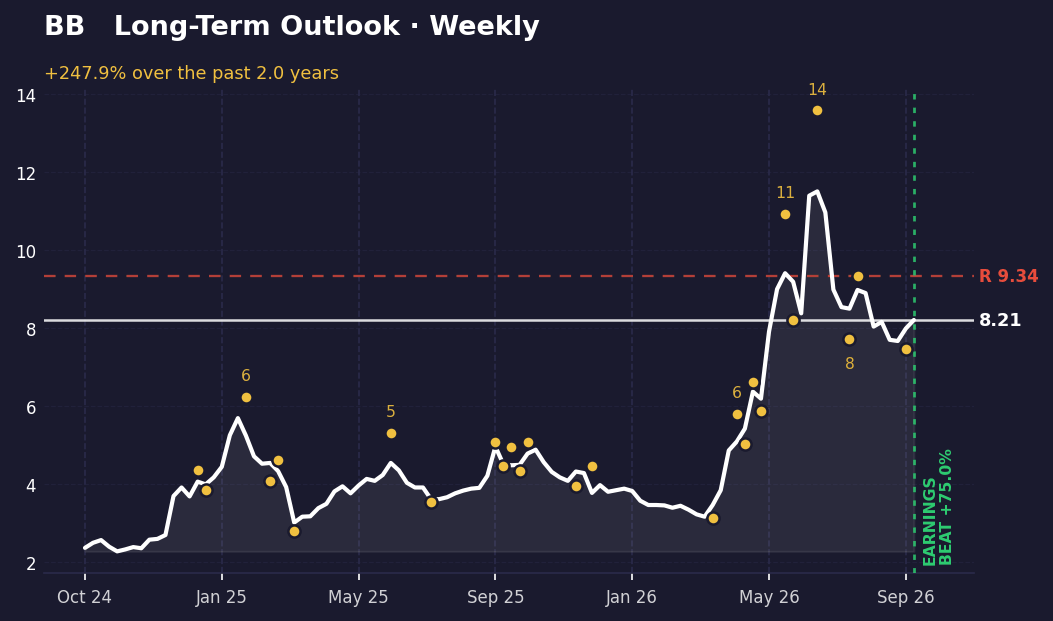
BlackBerry has climbed from $2.36 to $8.21 over the period shown—a 248% move—and just beat earnings by 75%. But the weekly and daily charts are telling different stories right now, and that conflict matters more than the headline gain.
The long-term picture
On the weekly chart, BlackBerry has traced a clear uptrend from its low of $2.27. The stock peaked at $13.59 in early July, then pulled back to $7.46 in mid-September before bouncing to $9.34 a week later. That $9.34 level is now the key resistance—the stock sits 13.8% below it at $8.21. The overall structure shows higher lows (the September low of $7.46 is well above the earlier $2.27 floor), which is the hallmark of an uptrend still intact.
Price is currently in the middle-to-upper half of its closing range over this period, at 64.3% of the way from lowest to highest close. The weekly picture is constructive: the trend is up, support is building, and the next meaningful test would be a break below $7.46.
The short-term picture
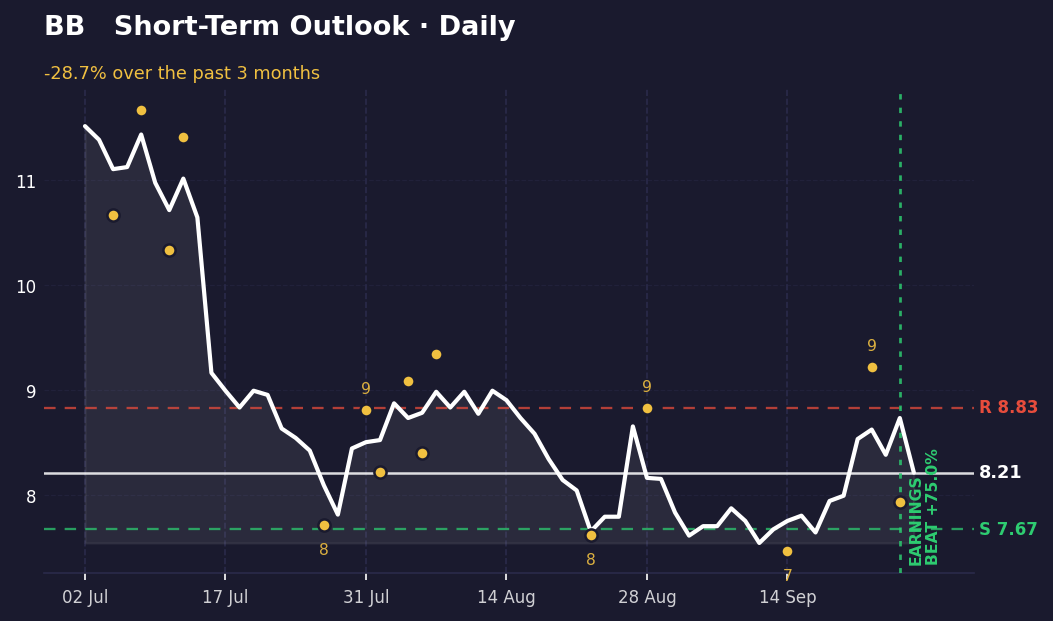
The daily chart tells a different story. BlackBerry has fallen 28.7% from its recent high of $11.51, and momentum has turned choppy. The stock bounced to $9.22 on September 22—the day of the earnings beat—but has since retreated. It's now sitting just 6.6% above its daily support level of $7.67, and only 7.6% below the daily resistance at $8.83.
This is a compressed range with the stock near the bottom of it. The daily momentum is weak; price is at just 16.9% of the way from the daily low to the daily high. The weekly chart wants to go higher, but the daily chart is showing sellers stepping in near $8.83. Until the stock can clear and hold above that daily resistance, the short-term pressure remains downward.
What's driving it
BlackBerry reported earnings on September 24 and beat expectations by 75%, which is a significant surprise. The company also raised its full-year outlook again, signaling confidence in its business momentum. The QNX engine—its core software platform—is delivering results, according to recent coverage.
However, analyst sentiment remains cautious despite the operational progress. Canaccord Genuity lowered its price target to $9.50, and RBC Capital maintains a Sector Perform rating with a $9 target. The gap between what the business is doing and what analysts are willing to value it at is the real story here.
What would change this
A break above $9.34 on the weekly chart would confirm that the uptrend is resuming and would invalidate the near-term weakness. That level is the swing high from early August and represents the ceiling of the recent consolidation. Clearing it would suggest the pullback from $13.59 is over.
Conversely, a close below $7.67 on the daily chart would break the support that's held since mid-September and would signal that the weekly uptrend is in real trouble. That would be the level to watch if selling accelerates. Right now, the stock is caught between these two scenarios, and the next few days will determine which one plays out.
Key takeaways
- BlackBerry has gained 248% from its low, but the weekly and daily charts are in direct conflict—one bullish, one bearish.
- The stock beat earnings by 75% and raised guidance, but analysts remain cautious and have set price targets near current levels.
- Daily support sits at $7.67 and daily resistance at $8.83; the stock is compressed between them with no clear direction.
- A weekly break above $9.34 would confirm the uptrend is alive; a daily close below $7.67 would signal the uptrend is broken.
This one was our pick. The next one is yours.
You've just read the public write-up for BB. A free account adds the full Pulse Report — the one that normally costs credits — on a symbol you choose, saved to your account and emailed to you.
- One full Pulse Report a week, on any symbol from the published list
- A five-symbol watchlist with live prices and signals
- Earnings dates, analyst targets, news and basic financials for what you follow
- Multi-timeframe charts with the indicators you choose
- Email alerts when something you're watching moves
- Deeper reports in three tiers when you want them — Pulse, Insight and Alpha
No card needed.
Research and education only — not financial advice, and not a recommendation to buy, sell or hold any security. Analysis is generated with AI assistance from measured price data and may contain errors. Prices shown were accurate at the last update. Full terms · How we produce this