Advanced Micro Devices, Inc. (AMD)
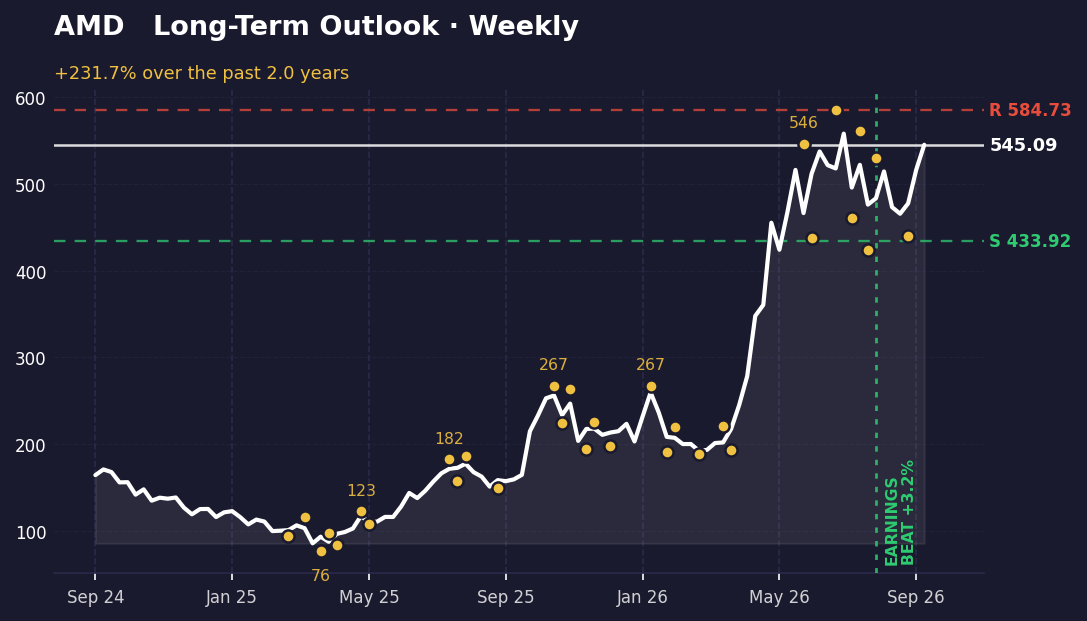
AMD is trading near its all-time high at 545.09, having climbed 231.7% from its starting point. The stock beat earnings on August 4th and has held its gains since. Both the weekly and daily charts are moving in the same direction, which is the kind of alignment that tends to matter when a stock is this extended.
The long-term picture
Over the past several months, AMD has traced a clear uptrend punctuated by two major pullbacks. The stock hit 561.47 in late July, pulled back to 424.03 by the end of that month, then recovered to 530.13 by early August. A second dip took it to 440.50 in early September, after which it climbed again. Today at 545.09, it sits just 2.3% below its all-time closing high of 557.89.
The weekly picture shows AMD positioned 20.4% above its support level of 433.92 and 7.3% below resistance at 584.73. The stock is at the extreme upper end of its recent range—97.3% of the way from its lowest to highest closing prices over this period. This positioning reflects a sustained rally, but it also means there's limited room to run before hitting structural resistance.
The short-term picture
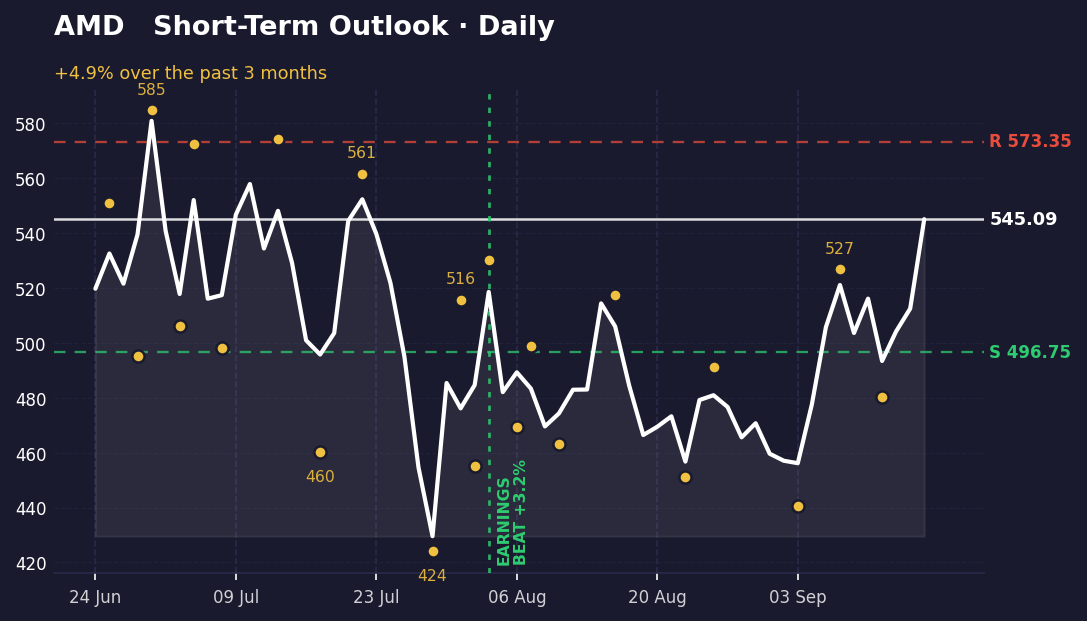
The daily chart tells a tighter story. AMD has moved 4.9% higher over the recent period, trading between 429.56 and 580.91. The most recent swing low came on September 14 at 480.33, and the stock has climbed 8.9% above that level to reach 545.09 today. It's now 5.2% below daily resistance at 573.35.
What matters here is that the daily momentum agrees with the weekly view—both are pointing upward. The stock is closer to its daily resistance than its daily support, but it hasn't yet tested either. The earnings beat in early August appears to have provided the foundation for this move, and the recent headlines about AI adoption and continued semiconductor demand suggest the narrative remains intact.
What's driving it
AMD reported earnings on August 4th and beat expectations by 3.21%, which marked a turning point on both charts. The company has since signaled that AI adoption remains in its early stages with no slowdown in demand expected. Recent market headlines highlight the broader $3.2 trillion chip boom and improving investor sentiment, though the Fear and Greed Index remains in fear territory despite the Nasdaq's recent strength. No major earnings date is immediately visible in the supplied data, so the current move appears driven by the August beat and the ongoing narrative around AI semiconductor demand.
What would change this
A break below the daily support at 496.75 would be the first meaningful signal that momentum is weakening. That level is 8.9% below the current price and represents the recent swing low from September 14. A close below it would suggest the uptrend is losing steam and could invite a retest of the weekly support at 433.92.
Conversely, a move above the daily resistance at 573.35 would confirm the strength and open the path toward the weekly resistance at 584.73. Breaking above 584.73 would be significant because it would put the stock into uncharted territory above its all-time high of 561.47. Either direction would clarify whether this rally has more room or is running out of fuel.
Key takeaways
- AMD is 2.3% below its all-time high of 557.89, having climbed 231.7% from its starting point.
- The stock beat earnings by 3.21% on August 4th and has held gains since, with both weekly and daily momentum aligned upward.
- Daily support sits at 496.75 (8.9% below current price) and daily resistance at 573.35 (5.2% above current price).
- The company reports no slowdown in AI demand, but the stock is positioned at the extreme upper end of its recent range with limited room before hitting structural resistance.
This one was our pick. The next one is yours.
You've just read the public write-up for AMD. A free account adds the full Pulse Report — the one that normally costs credits — on a symbol you choose, saved to your account and emailed to you.
- One full Pulse Report a week, on any symbol from the published list
- A five-symbol watchlist with live prices and signals
- Earnings dates, analyst targets, news and basic financials for what you follow
- Multi-timeframe charts with the indicators you choose
- Email alerts when something you're watching moves
- Deeper reports in three tiers when you want them — Pulse, Insight and Alpha
No card needed.
Research and education only — not financial advice, and not a recommendation to buy, sell or hold any security. Analysis is generated with AI assistance from measured price data and may contain errors. Prices shown were accurate at the last update. Full terms · How we produce this