Analog Devices, Inc. (ADI)
Analog Devices is still well above where it stood a year ago, but the last few sessions have pulled it lower. The weekly chart shows a strong multi-month climb, while the daily chart shows a short, sharp step back. Those two views point in different directions, which is the main thing worth understanding here.
The long-term picture
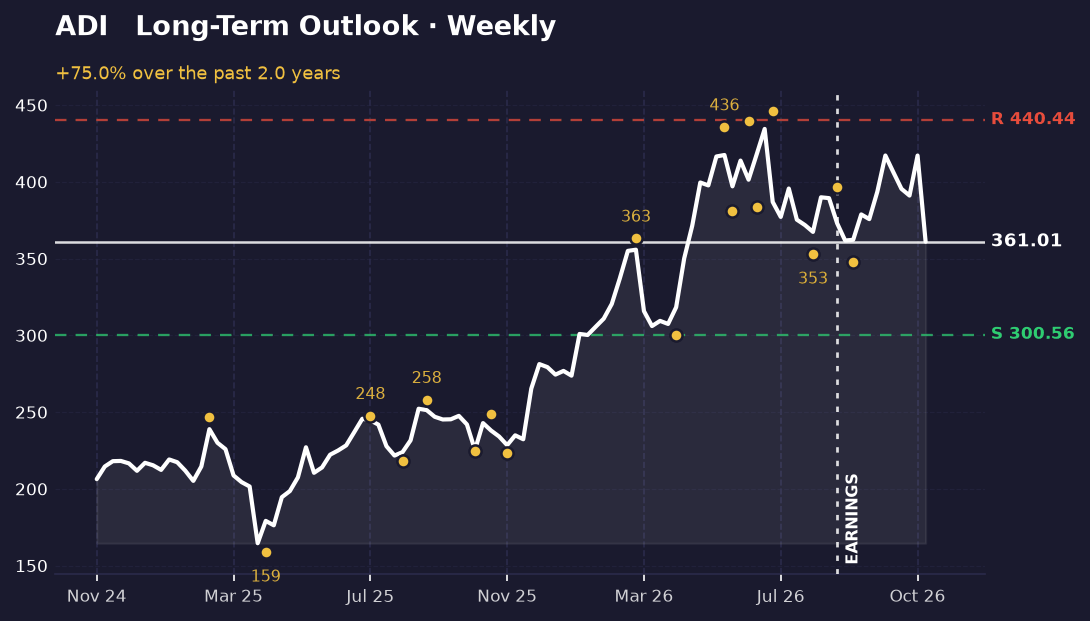
Over the period the weekly chart covers, ADI closed at 361.01, up from 206.35 at the start, a gain of about 75%. The stock has been making higher peaks and higher troughs. The most recent swing high came in late August at 396.95, and before that, late June's peak reached 445.91. The most recent swing low was 348.00 on September 4.
The weekly picture puts price in the upper part of its recent range, about 73% of the way from the lowest close to the highest. It sits roughly 17% below the highest close on the chart, so the stock has not yet recovered its peak, but it remains far above the lows it set earlier.
For the long-term structure to stay intact, the stock needs to keep holding above the roughly 300.56 support level, which sits about 17% below current prices.
The short-term picture
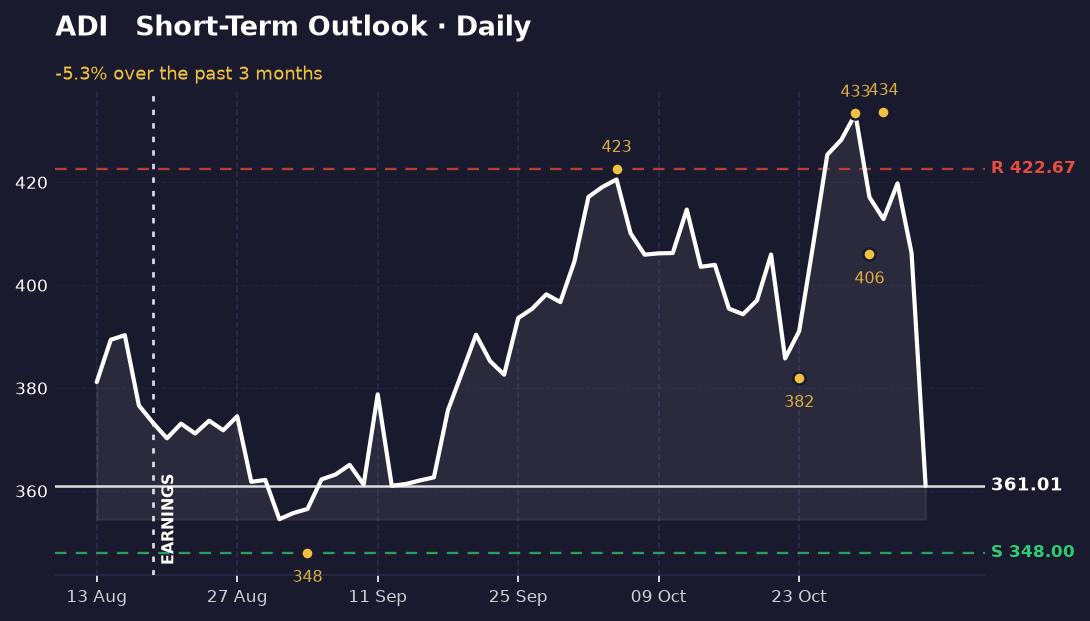
The daily chart tells a different story. Over the recent stretch, ADI fell about 5%, from 381.17 to 361.01. The stock is near the bottom of its recent closing range, at about 8% of the way up from the lowest close, which means it is close to its weakest levels of the period.
The nearest support on this chart is 348.00, only about 4% below the current price. Resistance sits higher, around 422.67, roughly 17% above. The short-term picture has been weakening even as the longer trend remains positive, and that gap between the two views is what makes this stock worth watching closely right now.
In plain terms: the big trend is up, but the last week or so has been down. Neither view cancels the other out.
What's driving it
The most recent earnings report was on August 19, 2026, and it is marked on both charts with a vertical line. The stock's movement around that date is visible on the charts, though this page does not draw conclusions about how the report itself was received.
Two headlines are relevant. Analog Devices has completed its acquisition of Alif Semiconductor, a company deal that adds to its product portfolio. Separately, a recent market report described one of the worst single days for chip stocks since 2020, with most of the largest names in the sector now in a bear market. That broader sector weakness is a plausible factor in the recent pullback, though the headlines alone don't confirm it as the cause for ADI specifically.
What would change this
The long-term read would weaken if ADI closes decisively below the 300.56 support level on the weekly chart. That would break the higher-lows pattern that has defined the climb and would suggest the uptrend has ended.
The short-term read would shift if the stock climbs back above the 422.67 resistance on the daily chart. That would reverse the recent pullback and bring the two timeframes back into agreement. A drop below 348.00 would deepen the short-term weakness and confirm that the pullback is more than a brief dip.
Key takeaways
- ADI is up about 75% over the weekly chart's full period but about 17% below its highest close.
- The weekly trend has been making higher lows, with the most recent low at 348.00 on September 4.
- The daily chart shows a 5% decline in recent days, with price near its lowest levels of the period.
- The weekly and daily views disagree right now, and the outcome depends on whether 348.00 and 300.56 hold.
This one was our pick. The next one is yours.
You've just read the public write-up for ADI. A free account adds the full Pulse Report — the one that normally costs credits — on a symbol you choose, saved to your account and emailed to you.
- One full Pulse Report a week, on any symbol from the published list
- A five-symbol watchlist with live prices and signals
- Earnings dates, analyst targets, news and basic financials for what you follow
- Multi-timeframe charts with the indicators you choose
- Email alerts when something you're watching moves
- Deeper reports in three tiers when you want them — Pulse, Insight and Alpha
No card needed.
Research and education only — not financial advice, and not a recommendation to buy, sell or hold any security. Analysis is generated with AI assistance from measured price data and may contain errors. Prices shown were accurate at the last update. Full terms · How we produce this